I analyzed the GDP data for (almost) all countries in the past decades and found stunning facts about the World we live in. The best part is.. you can challenge me! The whole analysis is Live on the link (Live Analysis of World GDP) and you can adjust filters, measure GDP in a different way, even add a new breakdown column!
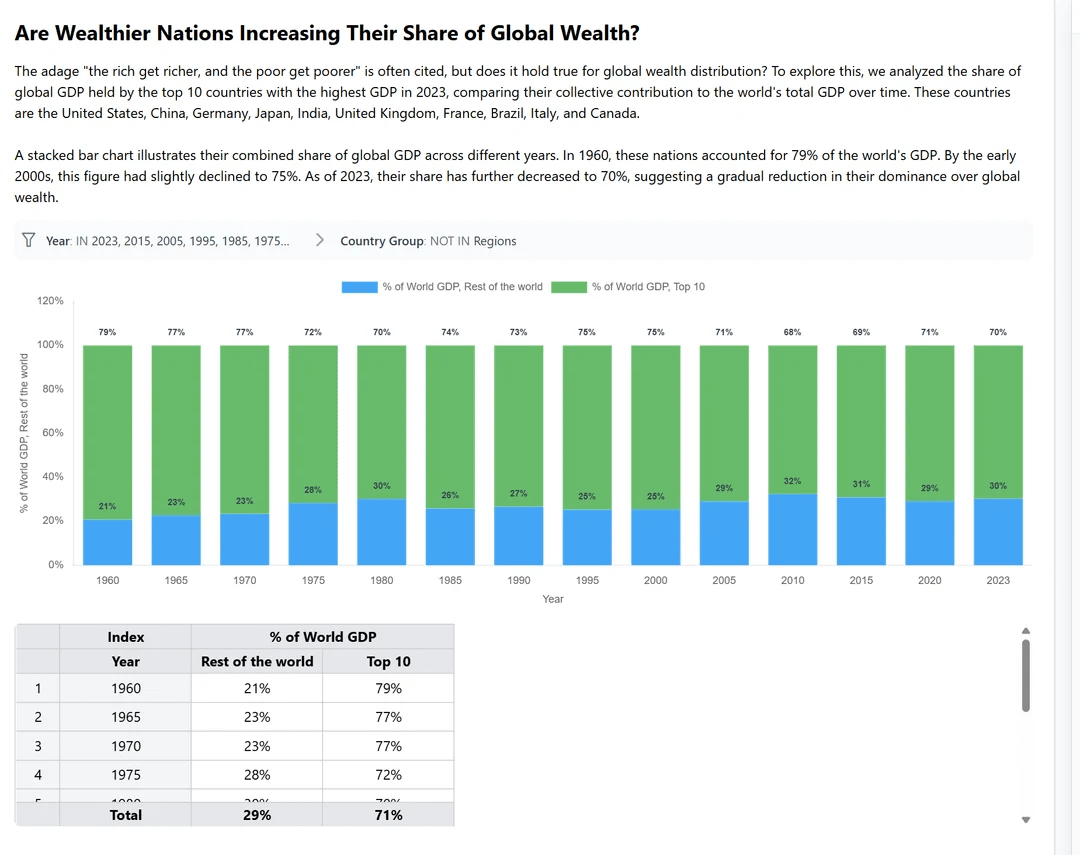
The adage "the rich get richer, and the poor get poorer" is often cited, but does it hold true for global wealth distribution? To explore this, we analyzed the share of global GDP held by the top 10 countries with the highest GDP in 2023, comparing their collective contribution to the world's total GDP over time. These countries are the United States, China, Germany, Japan, India, United Kingdom, France, Brazil, Italy, and Canada.
A stacked bar chart illustrates their combined share of global GDP across different years. In 1960, these nations accounted for 79% of the world's GDP. By the early 2000s, this figure had slightly declined to 75%. As of 2023, their share has further decreased to 70%, suggesting a gradual reduction in their dominance over global wealth.
Posted by FridayTea22
9 comments
I like your analysis but I don’t think it fit the research question.
The poor getting poorer isn’t dependent on whether the rich are getting richer or not (or at least, if it is, it should be proven first). The poor getting poorer is only dependent on their gdp ppp over time.
I mean even if your data shows that the poorer Countries are catching up in GDP ratio, even the opposite (the GDP ratio of a group declining) does not necessarily mean that a group gets poorer.
Even if wealthier countries were increasing their GDP share relative to poorer countries, it wouldn’t necessarily mean that the living standards in those poorer countries are declining. In fact, even with a smaller GDP share, poorer countries can still see improvements in living standards.
For example, advances in technology, healthcare, and education can significantly improve quality of life, regardless of GDP growth. The widespread availability of mobile phones and the internet has opened up new opportunities in developing nations, enhancing access to services and information. Additionally, foreign investment and global trade can drive economic growth in these countries, leading to better living conditions even without a proportional increase in GDP.
Thus, poorer countries can still experience progress and better living standards even if their GDP share lags behind wealthier nations.
Great analysis! To make it more accurate, you should have done it in the other direction: take the top 10 countries in 1960 and see if they maintain their share over time. The way you’ve done it you have survivorship bias, since by definition the top 10 countries in 2023 did reasonably well over that period.
I know others have made similar points already but you shouldn’t think of wealth as being a zero sum game. You can look at stats like the percentage of people without enough food to eat, as an extreme example, and see that that’s improved at the same time as rich countries have continued improving their own standards of living.
Total GDP doesnt answer this at all. Does the richer get richer because India has a growing population? India and China isnt even high income countries.
GDP per capita of the oecd population compared to the rest would probably get you the numbers you are looking for.
I mean it just looks like it fluctuates up and down a few percent since 1975. Not sure how the rest catching up match with the graph?
Even if share decreased, they could have a smaller share of a much larger pie. Then it would mean rich countries get richer and poor countries also get richer. If you define richer as having a greater share it’s not possible for both rich and poor countries to get richer.
Based on the graph, it looks like the percentage of wealth of the top 10 has stayed pretty stable since 1975 or 1980 – that’s the last 50 years. It’s only in the 1960-1975 year range that things shifted a bit.
>suggesting a gradual reduction in their dominance over global wealth.
Things look pretty static to me.
However, even if the relative wealth percentages have stayed the same, the wealth and quality of life of all countries can improve.
You put China and India Brazil three poor countries in 1960 in rich category seems quite bizarre way to look on this
Comments are closed.