Source: U.S. Bureau of Economic Analysis retrieved from FRED, Federal Reserve Bank of St. Louis
Tools: Datawrapper, Illustrator
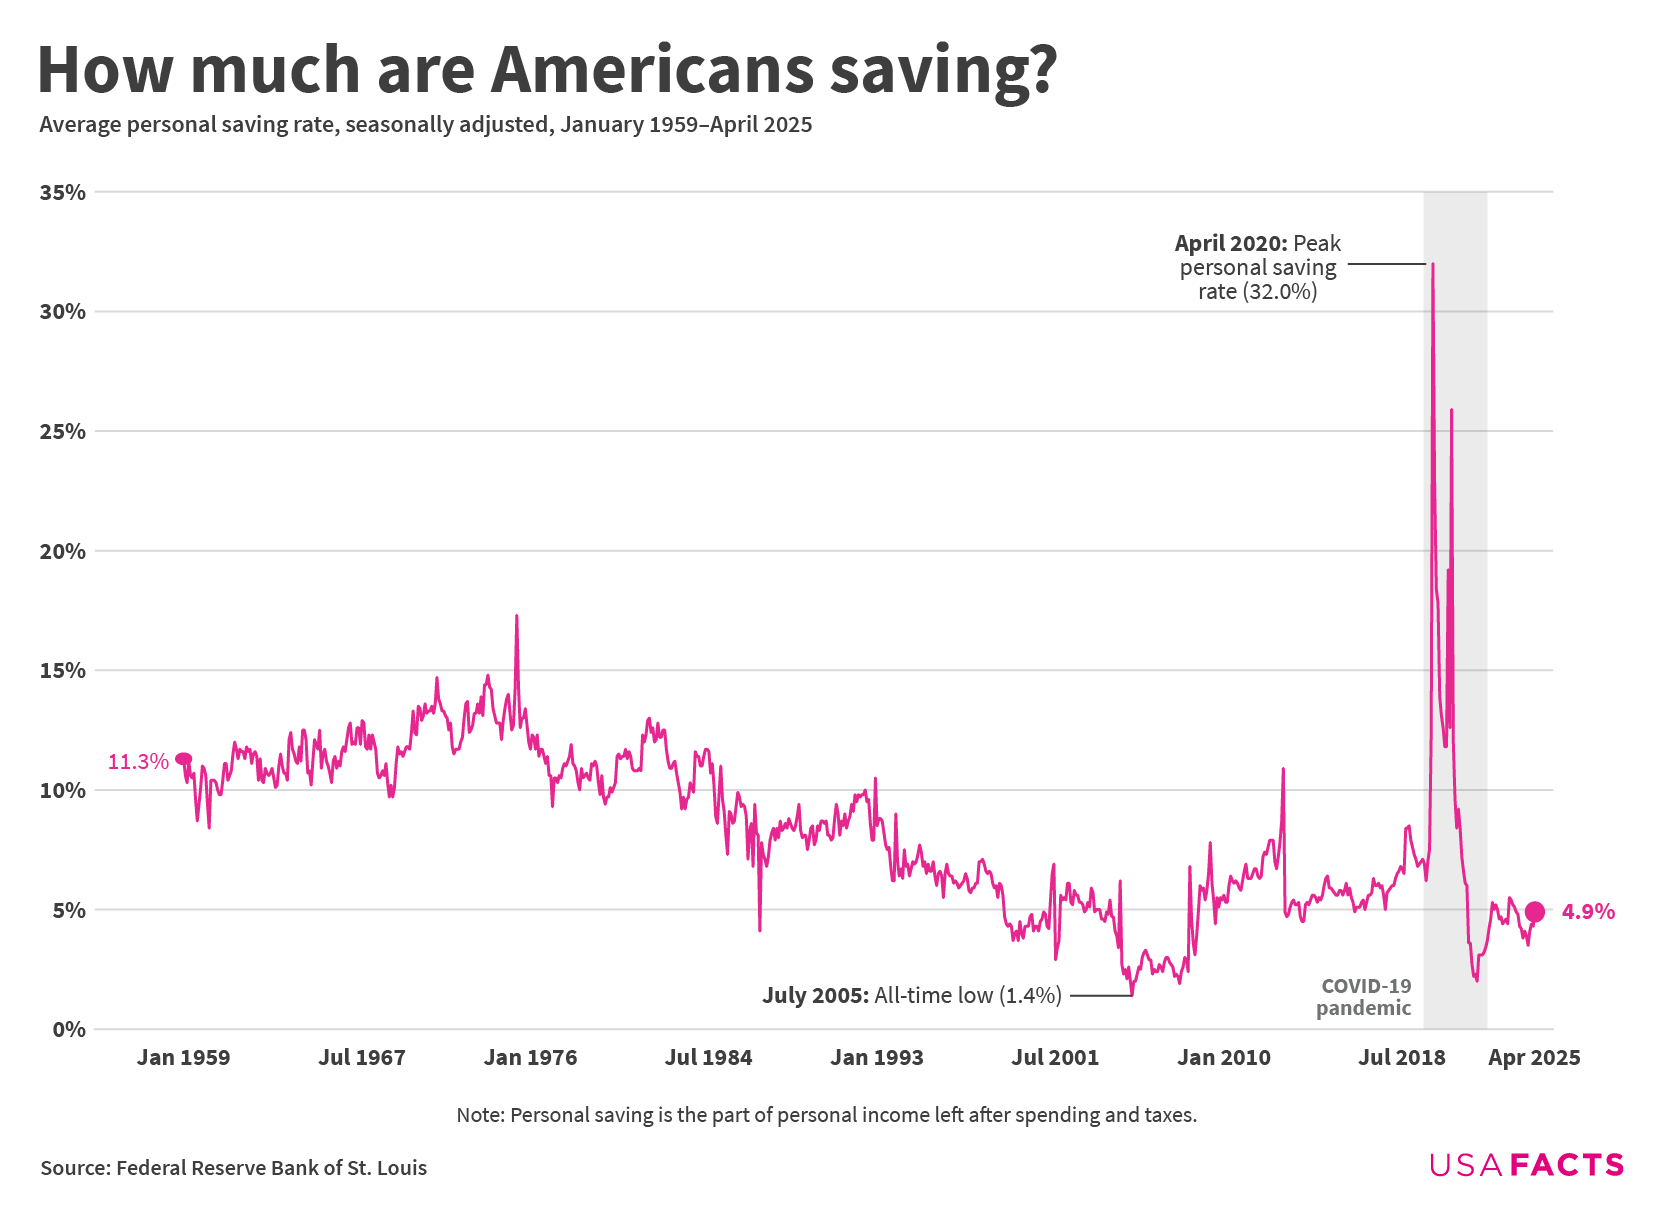
Note: Personal saving as a percentage of disposable personal income (DPI), frequently referred to as “the personal saving rate,” is calculated as the ratio of personal saving to DPI. Personal saving is equal to personal income less personal outlays and personal taxes; it may generally be viewed as the portion of personal income that is used either to provide funds to capital markets or to invest in real assets such as residences.
Simpler note: The personal saving rate is the share of disposable income people set aside after taxes and expenses, including money in checking and savings accounts, retirement plans like IRAs and 401(k)s, and other cash-based savings. It doesnŌĆÖt count increases in home values or stock market gains unless theyŌĆÖre cashed out.
IsnŌĆÖt it concerning that our savings rate increased 28% when we couldnŌĆÖt travel / eat out / go out like damn so people could save if they stayed home more
Americans arenŌĆÖt saving like they used to. In 2024, the average personal saving rate was 4.6% of disposable income. In the 1960s and 70s, Americans saved an average of 11.7%, with a high point of 17.3% in May 1975. Even the 2010s had a higher average saving rate than today, at 6.1%.
A few other moments stand out: There was a spike in savings during the early pandemic ŌĆö peaking at 32% in April 2020 ŌĆö due to stimulus checks, lockdowns, and reduced spending opportunities. But before that, the lowest point on record came in 2005, when savings dropped to just 1.4%. The FDIC pointed to high consumer and housing-related debt and a *sense* of financial security driven by strong economic indicators at the time.
I’m not sure I understand how this works. Like, on average, *everyone* is saving? Does it not go negative if you are consuming your savings?
These steep jumps in May 1975, April 1987, around 9/11, December 2012/January 2013 as well as the covid pandemic makes me wonder if these are
– artefacts of some kind of change of methodolgy of underlying time series
– changes because the denominator (the disposable income) did change drastically (which can be seen for the 2012/2013 change and covid pandemic)
– changes of the nominator (less spending and taxes), which is at least plausible for covid as well, where there were less oppurtunities to spend money.
That’s crazy. I am currently saving ~29% to buy a house and it still doesn’t feel like enough.
Whenever I hear the word “saving” in personal finance discussions, it’s often unclear to me whether it’s referring to literal money in cash account or if it also includes semi-liquid investments such as 401k’s, Roth IRA’s, or a stock portfolio. Based on the note at the bottom, I *think* this would exclude 401k investments, but not sure about IRAs or stocks.
It’s an important distinction. Someone would be in a far different financial position if they were saving 4.9% of their **salary** in cash alone vs saving 4.9% of their take-home after maxing out their 401k.
I would love to see this by quintile. And maybe remove the top 1% from the top quintile depending on how it screws the data.
I have job that I don’t make much money at. I don’t go out, I don’t willy nilly spend the money. Once a week when I get paid I buy all the food I need and pay bills. My friends who all have better jobs are completely blown away that I have over 50 grand saved since COVID.
Wasn’t that from those COVID relief checks that almost everyone got?
Seems like we are headed towards economic catastrophe as a country.
The skyrocketing cost of living, increased people living on credit, jobs going offshore, just not sustainable.
The billionaires don’t give a shit but they are too short sighted to see that even if they don’t care about the regular American (they don’t), if they are not able to afford products and services they are going to suffer as well. This country is so short sighted and it’s going to cost us all.
5% in the average & Americans wonder why they canŌĆÖt retire
Heh, I remember when there was literally nothing to spend money on.
Gonna guess childcare was a huge contributing factor here
This is an average I wonder what the values are by income percentile.
Shit down cruise ships. Save a fortune
That’s what happens when you hand out “free/stimulus” money. More gets saved, but more gets spent, then inflation happens, and when there is no more “free” money, prices don’t go down. Looking back, 1st round was probably ok, the 2nd was not, and the 3rd was reckless.
The time following 2020 is so criminal in terms of how news outlets and politicians put in so much effort and successfully made the population forget that the government has it in their power to help the people directly. While covid sucked, it was an unprecedented time for this generation where we had the vision of a more just society clear in front of us.
What is the story with 2005?
Great graph. That explains the spike in inflation as all that savings flowed back into the economy all at once. Then added to by Putin’s invasion of Ukraine.
We don’t have enough workers to support the next generation of retirees. If you’re not saving at all, you should live more frugally!
Are those peaks the COVID monetary handouts?
Should include when AmericanŌĆÖs received their stimulus checks.
The presentation is not beautiful, as the axis is hard to read, confounded by adding extra, unnecessary text of the months.
COVID was probably great for saving, IF you had a job that you could do from home.
Imagine the people who had debt and didn’t get paid during that time?
The problem with these overall measures is that they donŌĆÖt illuminate how people at different income levels behave differently. Since the bottom 50% of households only have about 2% of the wealth, you could legitimately decide to completely ignore them with only a small impact to your data, but this would be ignoring more than 100 MILLION people. Even saying that the chart is showing percentages does not solve the problem, unless you KNOW that the percentages were calculated individually, and not from national totals.
So our savings peaked at the same time it became unsafe to shop in person and unable to shop online due to supply chain issues?
ItŌĆÖs a good thing that saving period was ended quickly and everyone is back to hand-to-mouth
The drop in air travel and vacations in 2020 is literally visible as increased savings. Even with all the other COVID hobby expenditures.
When we stopped spending $5-10k to travel for holidays and vacations it made an incredible difference. Such a huge synchronized behavior change.
![[OC] How much money are Americans saving?](https://www.europesays.com/wp-content/uploads/2025/06/ol2v2764uh9f1-1661x1024.png)
37 comments
Source: U.S. Bureau of Economic Analysis retrieved from FRED, Federal Reserve Bank of St. Louis
Tools: Datawrapper, Illustrator
Note: Personal saving as a percentage of disposable personal income (DPI), frequently referred to as “the personal saving rate,” is calculated as the ratio of personal saving to DPI. Personal saving is equal to personal income less personal outlays and personal taxes; it may generally be viewed as the portion of personal income that is used either to provide funds to capital markets or to invest in real assets such as residences.
Simpler note: The personal saving rate is the share of disposable income people set aside after taxes and expenses, including money in checking and savings accounts, retirement plans like IRAs and 401(k)s, and other cash-based savings. It doesnŌĆÖt count increases in home values or stock market gains unless theyŌĆÖre cashed out.
IsnŌĆÖt it concerning that our savings rate increased 28% when we couldnŌĆÖt travel / eat out / go out like damn so people could save if they stayed home more
You guys are saving money?
https://preview.redd.it/eycs13aevh9f1.jpeg?width=520&format=pjpg&auto=webp&s=af807f82447ff873388ff46fee47fed730db8d7f
Hold on people are really only saving 5% of there money? That’s crazy to me.
Surprised it was 5%┬Ā
Thought was lower.
Is retirement savings (401k) counted here?
Here’s a very short summary of the [article on our site](https://usafacts.org/articles/why-arent-americans-saving-as-much-as-they-used-to/) about this data:
Americans arenŌĆÖt saving like they used to. In 2024, the average personal saving rate was 4.6% of disposable income. In the 1960s and 70s, Americans saved an average of 11.7%, with a high point of 17.3% in May 1975. Even the 2010s had a higher average saving rate than today, at 6.1%.
A few other moments stand out: There was a spike in savings during the early pandemic ŌĆö peaking at 32% in April 2020 ŌĆö due to stimulus checks, lockdowns, and reduced spending opportunities. But before that, the lowest point on record came in 2005, when savings dropped to just 1.4%. The FDIC pointed to high consumer and housing-related debt and a *sense* of financial security driven by strong economic indicators at the time.
[This CRS Report](https://www.congress.gov/crs-product/IF10963) (not a PDF, I promise) talks about the economic implications of the personal saving rate.
I was still gainfully employed. I bought i-bonds.
This percentage could easily be doubled if people actually applied discipline to their spending┬Ā
As with so many other data, things started going to shit in the early 70s, thanks Nixon! https://wtfhappenedin1971.com/
I’m not sure I understand how this works. Like, on average, *everyone* is saving? Does it not go negative if you are consuming your savings?
These steep jumps in May 1975, April 1987, around 9/11, December 2012/January 2013 as well as the covid pandemic makes me wonder if these are
– artefacts of some kind of change of methodolgy of underlying time series
– changes because the denominator (the disposable income) did change drastically (which can be seen for the 2012/2013 change and covid pandemic)
– changes of the nominator (less spending and taxes), which is at least plausible for covid as well, where there were less oppurtunities to spend money.
That’s crazy. I am currently saving ~29% to buy a house and it still doesn’t feel like enough.
Whenever I hear the word “saving” in personal finance discussions, it’s often unclear to me whether it’s referring to literal money in cash account or if it also includes semi-liquid investments such as 401k’s, Roth IRA’s, or a stock portfolio. Based on the note at the bottom, I *think* this would exclude 401k investments, but not sure about IRAs or stocks.
It’s an important distinction. Someone would be in a far different financial position if they were saving 4.9% of their **salary** in cash alone vs saving 4.9% of their take-home after maxing out their 401k.
I would love to see this by quintile. And maybe remove the top 1% from the top quintile depending on how it screws the data.
I have job that I don’t make much money at. I don’t go out, I don’t willy nilly spend the money. Once a week when I get paid I buy all the food I need and pay bills. My friends who all have better jobs are completely blown away that I have over 50 grand saved since COVID.
Wasn’t that from those COVID relief checks that almost everyone got?
Seems like we are headed towards economic catastrophe as a country.
The skyrocketing cost of living, increased people living on credit, jobs going offshore, just not sustainable.
The billionaires don’t give a shit but they are too short sighted to see that even if they don’t care about the regular American (they don’t), if they are not able to afford products and services they are going to suffer as well. This country is so short sighted and it’s going to cost us all.
Idk why this was aggregated by a third party but it’s readily available here:┬Ā┬Ā
https://fred.stlouisfed.org/series/PSAVERT
5% in the average & Americans wonder why they canŌĆÖt retire
Heh, I remember when there was literally nothing to spend money on.
Gonna guess childcare was a huge contributing factor here
This is an average I wonder what the values are by income percentile.
Shit down cruise ships. Save a fortune
That’s what happens when you hand out “free/stimulus” money. More gets saved, but more gets spent, then inflation happens, and when there is no more “free” money, prices don’t go down. Looking back, 1st round was probably ok, the 2nd was not, and the 3rd was reckless.
The time following 2020 is so criminal in terms of how news outlets and politicians put in so much effort and successfully made the population forget that the government has it in their power to help the people directly. While covid sucked, it was an unprecedented time for this generation where we had the vision of a more just society clear in front of us.
What is the story with 2005?
Great graph. That explains the spike in inflation as all that savings flowed back into the economy all at once. Then added to by Putin’s invasion of Ukraine.
We don’t have enough workers to support the next generation of retirees. If you’re not saving at all, you should live more frugally!
Are those peaks the COVID monetary handouts?
Should include when AmericanŌĆÖs received their stimulus checks.
The presentation is not beautiful, as the axis is hard to read, confounded by adding extra, unnecessary text of the months.
COVID was probably great for saving, IF you had a job that you could do from home.
Imagine the people who had debt and didn’t get paid during that time?
The problem with these overall measures is that they donŌĆÖt illuminate how people at different income levels behave differently. Since the bottom 50% of households only have about 2% of the wealth, you could legitimately decide to completely ignore them with only a small impact to your data, but this would be ignoring more than 100 MILLION people. Even saying that the chart is showing percentages does not solve the problem, unless you KNOW that the percentages were calculated individually, and not from national totals.
So our savings peaked at the same time it became unsafe to shop in person and unable to shop online due to supply chain issues?
ItŌĆÖs a good thing that saving period was ended quickly and everyone is back to hand-to-mouth
The drop in air travel and vacations in 2020 is literally visible as increased savings. Even with all the other COVID hobby expenditures.
When we stopped spending $5-10k to travel for holidays and vacations it made an incredible difference. Such a huge synchronized behavior change.
Comments are closed.