Too bad for Sardinians, it doesn’t work when doing it with sheep !
Fantastic that some lakes in the Netherlands have birth rates!
So paris is.. the actual city of love ¤śē
Is this birth rate per person or birth rate per woman
For reference, the replacement rate to maintain population levels is 2.1 births per woman.
The differences right across country borders is insane. Do we think those are real?
Interesting, you can see how countries that have struggled financially this last decade tend to be the ones having fewer babies
UK still exists in Europe thanks.
>The total fertility rate (TFR) in England and Wales dropped to 1.44 children per woman, its lowest value since records began in 1938; Wales and the North West of England experienced the largest declines in TFR compared with 2022.
The ottomans east of Constantinople are in the map but Ukraine is not?
so, every major city with a significantly large immigrant population has a higher birth rate
interesting
I like this chart because it looks like lava
French really is the language of love.┬Ā
The high unemployment rate in Spain might be an indicator for what to expect with birthrates worldwide if automation takes over.┬Ā┬Ā
Maybe there’s much more to it.
Something feels off. How can Bulgaria show such bright colors if it’s one of the most rapidly declining populations in Europe and according to Wikipedia its TFR was 1.58 in 2021?
So from what I’ve seen today Europeans and south Koreans need to get busy lol.
I think Is TFR not birth rate
As Lithuanian I thought that the situation is similarly bad basically everywhere though now I’m not sure if I should be happy or envious that we are basically the worst one
Why would turkey be listed but not Ukraine, the Uk, Bosnia-herzegovina, Belarus, Moldova, Russia
Anyone have a hypothesis for why countries like Italy and Spain have lower birth rates than Germany and the Nordics states? My guess would be they’d have higher rates by being predominately catholic (with emphasis on families and restriction on birth control)
Comon Italy, even with that thigh high boot?
Too bad the map has to follow Nuts rather than them being more available
Now overlay it with quality of life metrics and see the same map.
We can barely sustain clean water in most of the populated world. There are plastics in every living being, and corner of planet, greenhouse gases are nearly at prehistoric levels because we can’t seem to control our consumption, but… if only we were having more babies to keep our economies going. -_-
Does this mean spain is welcoming of expats from other countries right now?
In a generation the demographics and religion in these regions will vary wildly. ItalyŌĆÖs demographics will be primarily immigrant for those under 30
I’m surprised that there are such large differences between regions directly across national borders. Common understanding of birth rate trends is that they are influenced less by national policies, and more a factor of cultural norms such as female educational attainment and workforce participation. One would expect that cultural norms would be somewhat contiguous across European borders, given many years of Schengen zone integration.
Surprised to see Poland so low.┬Ā
The highest Birth Rate in Europe has been consistently Ireland, followed by the UK and France during the last 20 years. Then Another group composed mainly by the Scandinavian countries and the Netherlands. All the rest have lower birth rates. More impressive is Germany that despite being the country that has absorbed the largest amount of foreigners in the last 25 years still has a much lower birth rate, might be that nearly all those foreigners are unaccompanied young men.. lol
Also, why including turkey, when only 3% of turkey is within Europe.. the rest is Asia.
Norway now has a birth rate about 1.4, it has gone down significantly the last 5 years (not from 2.1, but more like 1.7+). Anyhow, this birthrate means our sovereign wealth fund, which is absurdly large on a per capita basis, is expected to go empty in 50-60 years. Some European countries have had 1.4 birth rate for 50 years.
I think the ride is about to stop.
This is the 8th birthrate/fertility rate graph this week.
This is like 30th ferility map I have seen this week.
this sub and mapporn are now nothing but maps and graphs of fertility.
Do you guys have no other data?
What’s going on in Sardinia?
Lithuania/Latvia is a strong contrast. Anybody know why?
So what is the criteria for including Turkey in European maps? It feels like Turkey is only included when people are trying to make a point.
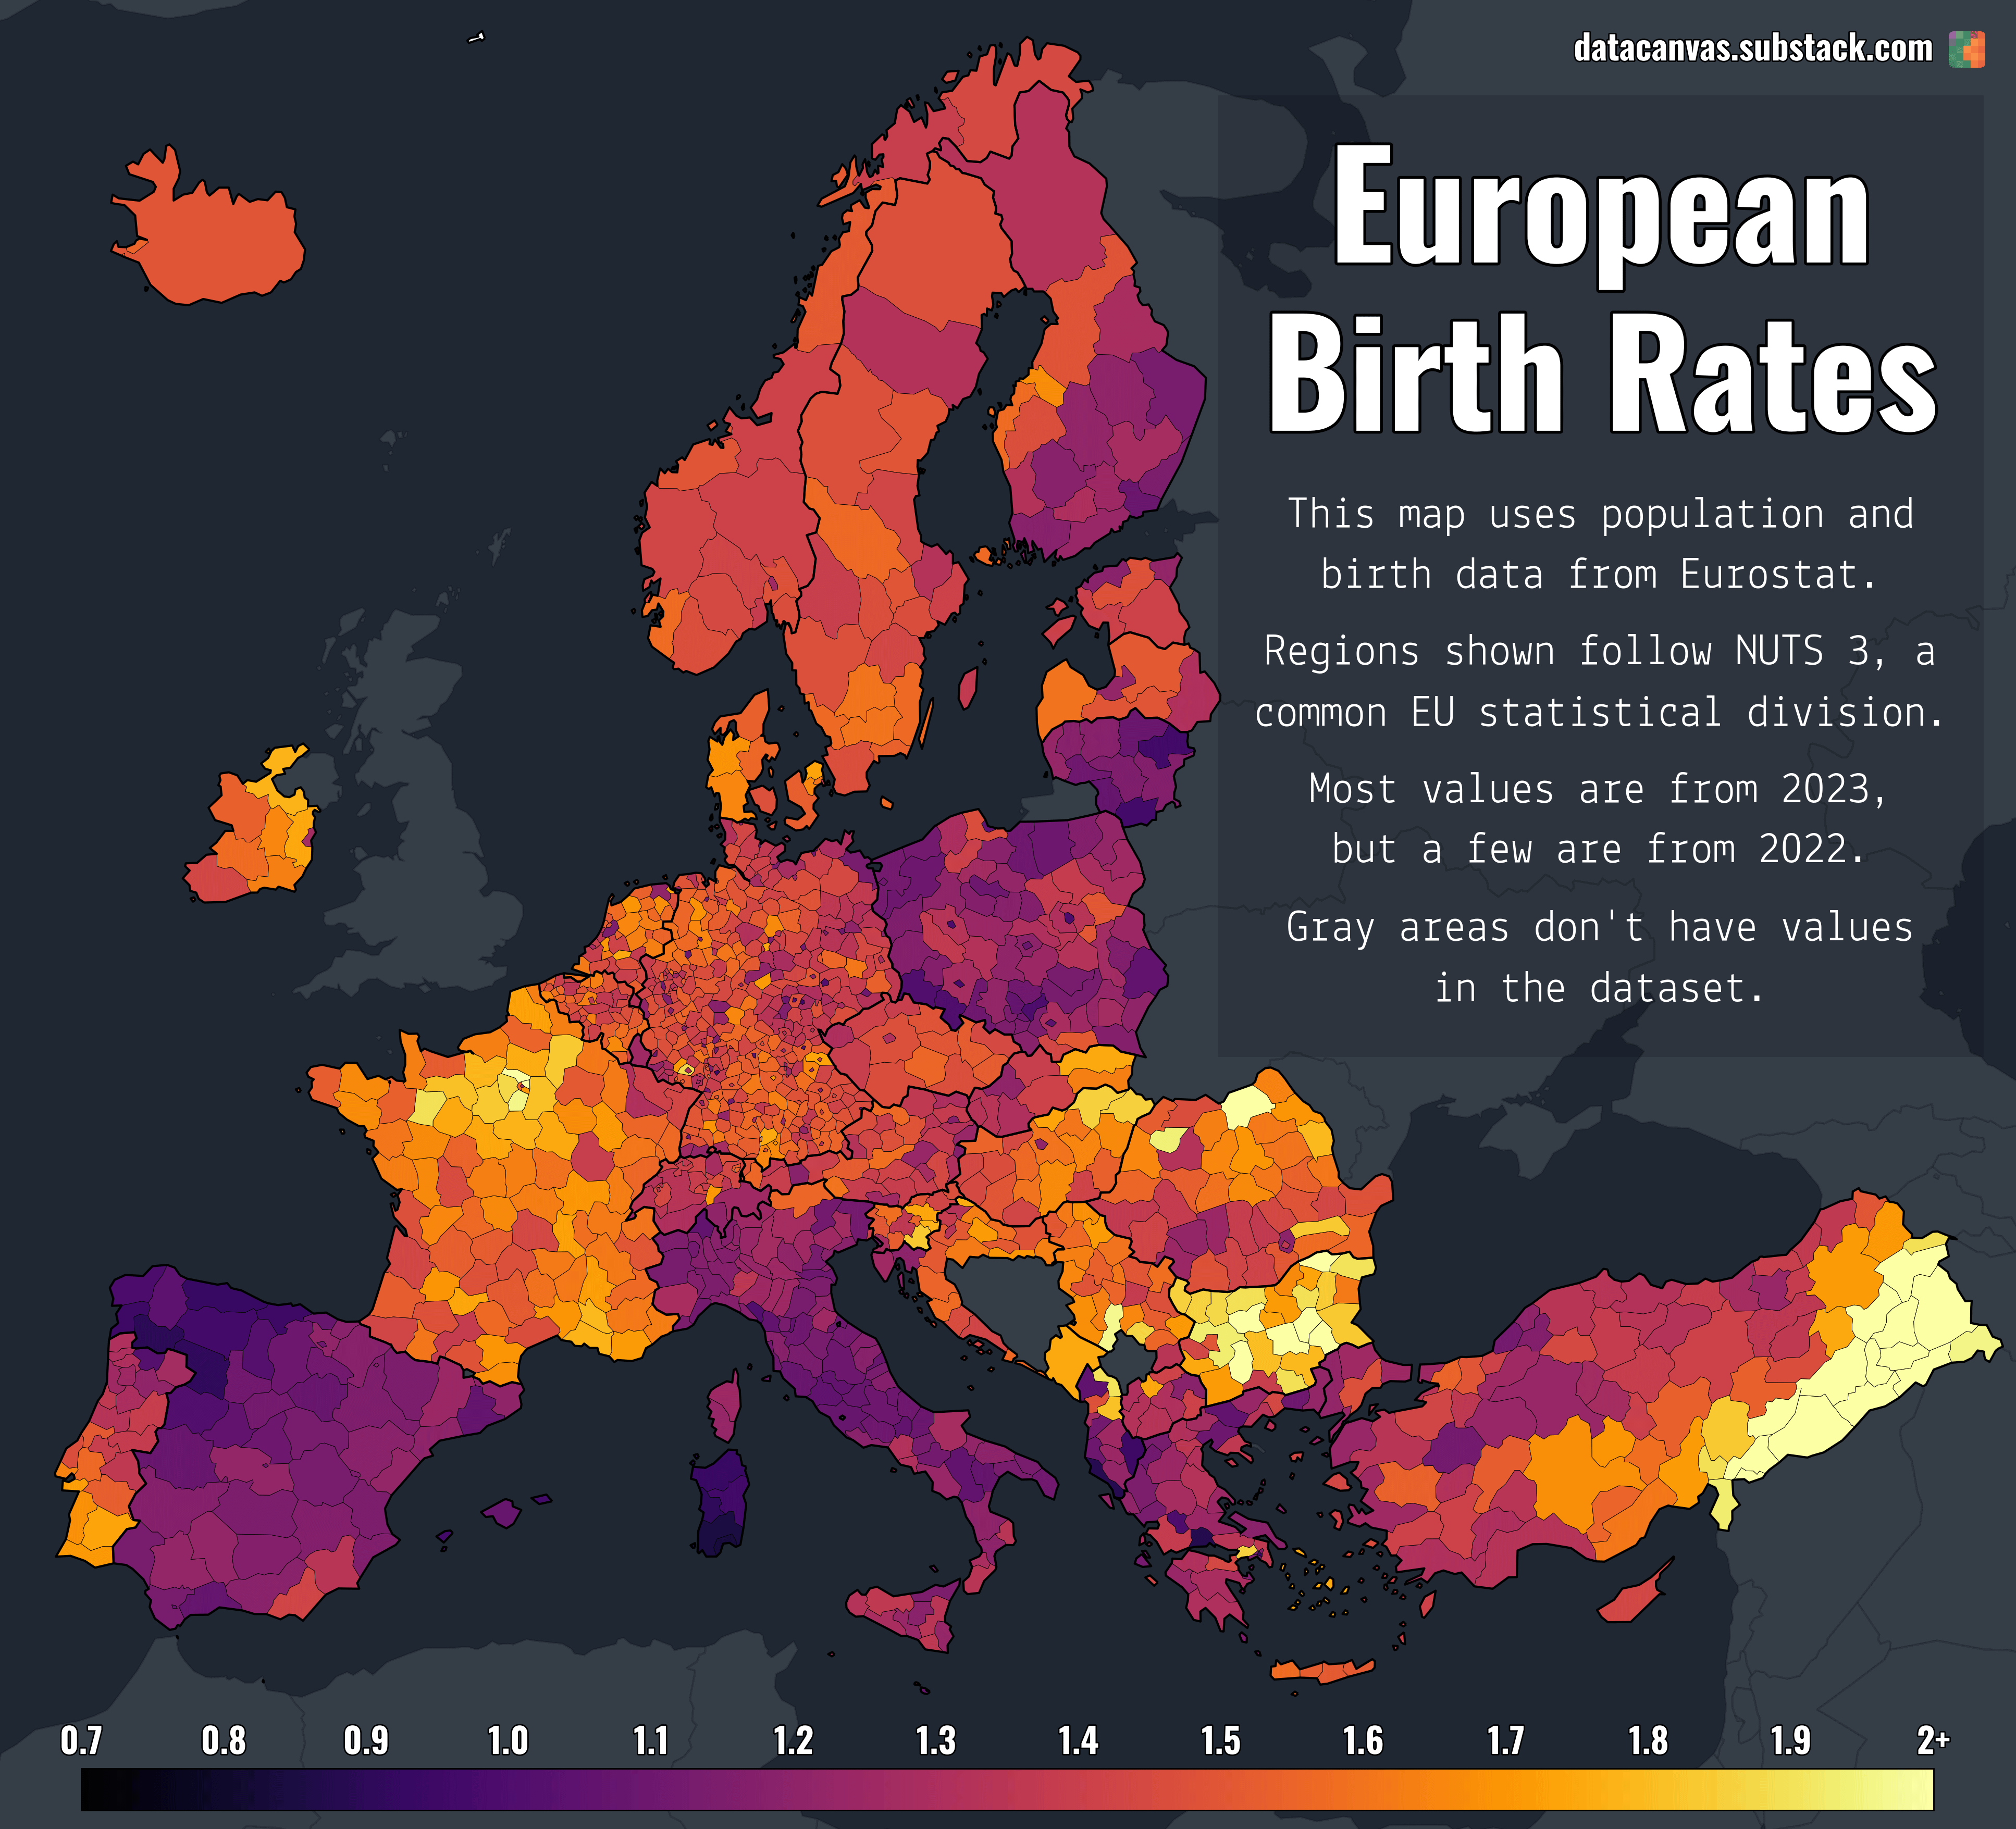
![[OC] Birth Rates Across Europe](https://www.europesays.com/wp-content/uploads/2025/07/gkv9skj9dhaf1-1920x1024.png)
35 comments
Too bad for Sardinians, it doesn’t work when doing it with sheep !
Fantastic that some lakes in the Netherlands have birth rates!
So paris is.. the actual city of love ¤śē
Is this birth rate per person or birth rate per woman
For reference, the replacement rate to maintain population levels is 2.1 births per woman.
The differences right across country borders is insane. Do we think those are real?
Interesting, you can see how countries that have struggled financially this last decade tend to be the ones having fewer babies
UK still exists in Europe thanks.
>The total fertility rate (TFR) in England and Wales dropped to 1.44 children per woman, its lowest value since records began in 1938; Wales and the North West of England experienced the largest declines in TFR compared with 2022.
https://www.ons.gov.uk/peoplepopulationandcommunity/birthsdeathsandmarriages/livebirths/bulletins/birthsummarytablesenglandandwales/2023
Edit. We are so back
https://blog.ons.gov.uk/2024/10/09/arrangement-marks-a-new-era-of-statistical-cooperation-with-eurostat/
The ottomans east of Constantinople are in the map but Ukraine is not?
so, every major city with a significantly large immigrant population has a higher birth rate
interesting
I like this chart because it looks like lava
French really is the language of love.┬Ā
The high unemployment rate in Spain might be an indicator for what to expect with birthrates worldwide if automation takes over.┬Ā┬Ā
Maybe there’s much more to it.
Something feels off. How can Bulgaria show such bright colors if it’s one of the most rapidly declining populations in Europe and according to Wikipedia its TFR was 1.58 in 2021?
So from what I’ve seen today Europeans and south Koreans need to get busy lol.
I think Is TFR not birth rate
As Lithuanian I thought that the situation is similarly bad basically everywhere though now I’m not sure if I should be happy or envious that we are basically the worst one
Why would turkey be listed but not Ukraine, the Uk, Bosnia-herzegovina, Belarus, Moldova, Russia
Anyone have a hypothesis for why countries like Italy and Spain have lower birth rates than Germany and the Nordics states? My guess would be they’d have higher rates by being predominately catholic (with emphasis on families and restriction on birth control)
Comon Italy, even with that thigh high boot?
Too bad the map has to follow Nuts rather than them being more available
Now overlay it with quality of life metrics and see the same map.
This is why everyone should watch [this](https://youtu.be/LBudghsdByQ?si=ufilTk15Jyqqw-Mp)
Galician bothers, what’s happening over there?
We can barely sustain clean water in most of the populated world. There are plastics in every living being, and corner of planet, greenhouse gases are nearly at prehistoric levels because we can’t seem to control our consumption, but… if only we were having more babies to keep our economies going. -_-
Does this mean spain is welcoming of expats from other countries right now?
In a generation the demographics and religion in these regions will vary wildly. ItalyŌĆÖs demographics will be primarily immigrant for those under 30
I’m surprised that there are such large differences between regions directly across national borders. Common understanding of birth rate trends is that they are influenced less by national policies, and more a factor of cultural norms such as female educational attainment and workforce participation. One would expect that cultural norms would be somewhat contiguous across European borders, given many years of Schengen zone integration.
Surprised to see Poland so low.┬Ā
The highest Birth Rate in Europe has been consistently Ireland, followed by the UK and France during the last 20 years. Then Another group composed mainly by the Scandinavian countries and the Netherlands. All the rest have lower birth rates. More impressive is Germany that despite being the country that has absorbed the largest amount of foreigners in the last 25 years still has a much lower birth rate, might be that nearly all those foreigners are unaccompanied young men.. lol
Also, why including turkey, when only 3% of turkey is within Europe.. the rest is Asia.
Norway now has a birth rate about 1.4, it has gone down significantly the last 5 years (not from 2.1, but more like 1.7+). Anyhow, this birthrate means our sovereign wealth fund, which is absurdly large on a per capita basis, is expected to go empty in 50-60 years. Some European countries have had 1.4 birth rate for 50 years.
I think the ride is about to stop.
This is the 8th birthrate/fertility rate graph this week.
This is like 30th ferility map I have seen this week.
this sub and mapporn are now nothing but maps and graphs of fertility.
Do you guys have no other data?
What’s going on in Sardinia?
Lithuania/Latvia is a strong contrast. Anybody know why?
So what is the criteria for including Turkey in European maps? It feels like Turkey is only included when people are trying to make a point.
Comments are closed.