Largest transfer of wealth in human history. Just… Not the way we hoped.
What’s wild to me is that the group this bill helps the most are higher earners, who are statistically more liberal leaning and college educated. Meanwhile the statistically higher percentage Republican poor continue to vote to fuck themselves over.
I have the utmost respect for the YBL team but i don’t get what’s going on here
Who are those people in the top 0.1% who are hurt by Medicaid cuts?
What is the first quintile supposed to represent? It’s not in the legend and if it’s less than $13K, why bother with a separate group? Why not just use BLS brackets?
So if an able-bodied person on Medicaid without a job now goes off Medicaid and gets a full time job, how does their net improvement show up in the graph?
The number of people in the lower quintiles who voted for these policies never fails to baffle me.
At least they’re getting what they voted for.
Is this saying that for those that don’t qualify for Medicaid or Snap, the bill is always a net benefit?
They are basically saying you can’t be poor or else we will f**k you more. Interesting times folks, interesting times
I’m the 5th (not top 10% though) and I don’t want this. People in the lower 4 quintiles need help more than I need a 2.4% tax break. Unless I’m misreading this graph.
Edit I meant that I’m 5th but not top 10%. And anyone downvoting this is a prick you either make at least as much as I do and are being a greedy monster or you’re self hating bottom 4 quintiles.
You are only worth as much as you work!
I am actually surprised to see how much quantile 4(People that make 64K a year) and higher’s taxes are postivitely impacted. I had thought the bill wasn’t going to have any positive impact on my taxes from all the news I have read.
I don’t understand why 99% of Americans aren’t horrified at this data.
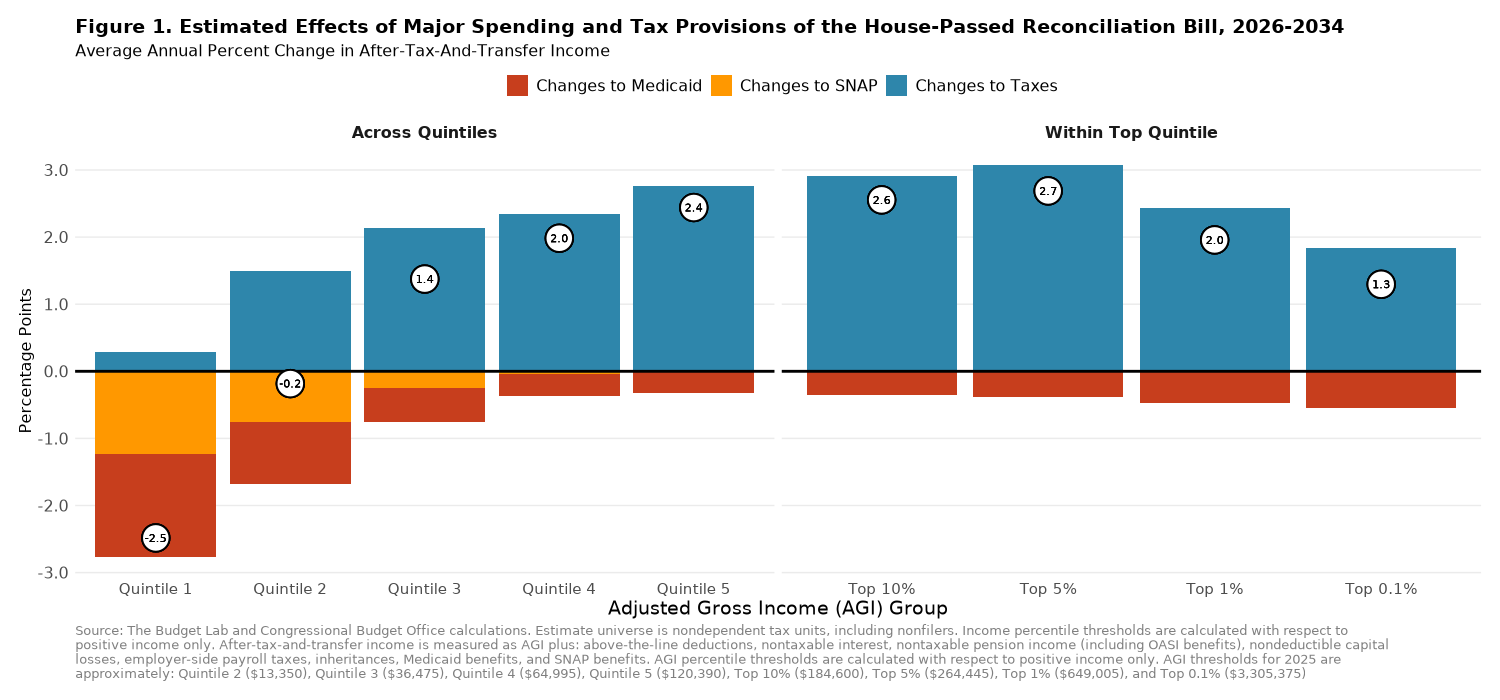
In the fine print, quintile 1 are people with an income of less than $13,350 *per year*. The bottom 40% of society are people making *less than $36,475 per year*. How on earth is this sensible policy? For *anybody*? Like, 40% of Americans just got screwed over. How are Republicans still in office?
Even worse, they list the top 1% as having an income of at least $649,000 per year. For the top 0.1%? $3,305,375 *per year* (put differently, these are people who make *at least* ~248 times what the lowest quintile earns, or *at least* ~100 times what the poorest 40% of Americans earn). And that’s setting aside their massive net worth, which they can leverage to make money as well. Why on earth would we cut taxes for these people? Are they somehow hurting?
Why do wealthy people need a tax cut? Why do poor people need the benefits they receive slashed? What possible good does it bring to our society? And all this from the party who’s been howling about the national debt for the last five years?
edit: and I say this as someone who stands to benefit *significantly*. I don’t fucking need it, and I am horrified by it. The idea that we should cut food stamps and medical care for poor people so wealthy people and corporations can get a smaller tax bill is revolting.
It would be interesting to see these numbers in absolute terms as well (eg multiply by mean income within each quintile). I suspect the key takeaway from this graph is that people in the lower 3 quintiles see marginal differences, and people in the upper two quintiles (and especially upper 1% and above) see huge quantitative increases relative to the lower.
Wait, am I seeing this right… anyone who doesn’t rely on Medicaid or SNAP will benefit from the bill?
If we give enough to the rich, one day they will be sated and not ask for any more, right?
This bill removed AMT for people making over 1m a year, which cost 1.3T. to pay for that we cut medicaid and snap which saved 1.2T. Not even 3rd world countries pull this stuff off.
Republicans are hoping that people see lower taxes on their returns and not realize they’re actually paying more for everything else. Guess what, it’s going to work. You want to know how I know? It happened last time.
YBL is very good and smart people. Have met them. Much approved.
Would be better if it showed net positive or negative percentage. It’s hard to read this chart otherwise
Capitalism is doing as capitalism does.
I just found it amazing that every time a super confusing chart is posted everyone seems to get it instantly and begins to discuss.
Who can explain to me how to read this chart? Do people get tax increases across the board?
So… It’s a tax cut. If you don’t pay taxes then you don’t get the benefit of a tax cut.
24 comments
The Yale Budget Lab does great analysis of proposed bills and their impacts, located here:
https://budgetlab.yale.edu/
This specific analysis was done for the Big Beautiful Bill, and is found here:
https://budgetlab.yale.edu/research/distributional-effects-selected-provisions-house-and-senate-reconciliation-bills
Largest transfer of wealth in human history. Just… Not the way we hoped.
What’s wild to me is that the group this bill helps the most are higher earners, who are statistically more liberal leaning and college educated. Meanwhile the statistically higher percentage Republican poor continue to vote to fuck themselves over.
I have the utmost respect for the YBL team but i don’t get what’s going on here
Who are those people in the top 0.1% who are hurt by Medicaid cuts?
What is the first quintile supposed to represent? It’s not in the legend and if it’s less than $13K, why bother with a separate group? Why not just use BLS brackets?
So if an able-bodied person on Medicaid without a job now goes off Medicaid and gets a full time job, how does their net improvement show up in the graph?
The number of people in the lower quintiles who voted for these policies never fails to baffle me.
At least they’re getting what they voted for.
Is this saying that for those that don’t qualify for Medicaid or Snap, the bill is always a net benefit?
They are basically saying you can’t be poor or else we will f**k you more. Interesting times folks, interesting times
I’m the 5th (not top 10% though) and I don’t want this. People in the lower 4 quintiles need help more than I need a 2.4% tax break. Unless I’m misreading this graph.
Edit I meant that I’m 5th but not top 10%. And anyone downvoting this is a prick you either make at least as much as I do and are being a greedy monster or you’re self hating bottom 4 quintiles.
You are only worth as much as you work!
I am actually surprised to see how much quantile 4(People that make 64K a year) and higher’s taxes are postivitely impacted. I had thought the bill wasn’t going to have any positive impact on my taxes from all the news I have read.
I don’t understand why 99% of Americans aren’t horrified at this data.
In the fine print, quintile 1 are people with an income of less than $13,350 *per year*. The bottom 40% of society are people making *less than $36,475 per year*. How on earth is this sensible policy? For *anybody*? Like, 40% of Americans just got screwed over. How are Republicans still in office?
Even worse, they list the top 1% as having an income of at least $649,000 per year. For the top 0.1%? $3,305,375 *per year* (put differently, these are people who make *at least* ~248 times what the lowest quintile earns, or *at least* ~100 times what the poorest 40% of Americans earn). And that’s setting aside their massive net worth, which they can leverage to make money as well. Why on earth would we cut taxes for these people? Are they somehow hurting?
Why do wealthy people need a tax cut? Why do poor people need the benefits they receive slashed? What possible good does it bring to our society? And all this from the party who’s been howling about the national debt for the last five years?
edit: and I say this as someone who stands to benefit *significantly*. I don’t fucking need it, and I am horrified by it. The idea that we should cut food stamps and medical care for poor people so wealthy people and corporations can get a smaller tax bill is revolting.
It would be interesting to see these numbers in absolute terms as well (eg multiply by mean income within each quintile). I suspect the key takeaway from this graph is that people in the lower 3 quintiles see marginal differences, and people in the upper two quintiles (and especially upper 1% and above) see huge quantitative increases relative to the lower.
Wait, am I seeing this right… anyone who doesn’t rely on Medicaid or SNAP will benefit from the bill?
If we give enough to the rich, one day they will be sated and not ask for any more, right?
This bill removed AMT for people making over 1m a year, which cost 1.3T. to pay for that we cut medicaid and snap which saved 1.2T. Not even 3rd world countries pull this stuff off.
Republicans are hoping that people see lower taxes on their returns and not realize they’re actually paying more for everything else. Guess what, it’s going to work. You want to know how I know? It happened last time.
YBL is very good and smart people. Have met them. Much approved.
Would be better if it showed net positive or negative percentage. It’s hard to read this chart otherwise
Capitalism is doing as capitalism does.
I just found it amazing that every time a super confusing chart is posted everyone seems to get it instantly and begins to discuss.
Who can explain to me how to read this chart? Do people get tax increases across the board?
So… It’s a tax cut. If you don’t pay taxes then you don’t get the benefit of a tax cut.
Im just above quintile 5. Why is this bad for me
Comments are closed.