This is an updated of an [older plot](https://www.reddit.com/r/dataisbeautiful/comments/1ijdqts/oc_magnificent_7_valuation_growth_and_margins/) I made depicting the valuation, growth, and margins for the Magnificent 7. Based on feedback from the last go-around, I’m depicting each company with a consistent logo size so that they can be easily visualized, since with the previous depiction, outliers such as Tesla were easy to miss. Instead, the area of the surrounding circle will be proportional to the company’s market cap. Net profit margins are annotated below the logos.
Additionally, I decided to include all 18 companies with a market cap exceeding $400 billion. However, as it turns out, some of the data points would cause the graph to be too congested–as such, V, MA, and COST are excluded, but all the data are shown in the table below.
– Growth rate and net margin are obtained from Macrotrends for each company.
– P/E ratio and market cap are obtained using Microsoft Excel, as of 7/3/25 market close.
– Plot was generated using Python Matplotlib.
[deleted]
One of these things is not like the others
One of these things does not belong
I think Google is slightly undervalued. I understand that AI is a large threat to their search core business and that there are some litigation risks out there. However, they have done a decent job of diversifying their business into several strong platforms and their AI models seem to be decent. They have some best-in-class properties in Youtube, and Waymo which are still growing. I’m very bullish on Waymo especially.
Looking at Apple which has negative growth and is valued at 30 pe vs Google’s 20
Maybe the better comparable would be Meta 45.62% growth rate compared to 34.69%. 27 PE vs 20 PE. I think the core of Facebook is comparable to Google search. It’s growing but the numbers aren’t impressive and I suspect active users will decline in the coming years, especially in the North American region. NA is the highest ARPU (Average Revenue Per User) region ($68). Their userbase has been steady for the last 3 years but the younger demographic isn’t getting onto Meta’s apps that much.
Using 9.59 for Google’s 2025 EPS and a PE of 24 (conservative) we get $230.16 for what is IMO a low end fair value
Running a NPV with a 10% rise in earnings for the next 3 years, then a 6% growth rate (conservative) afterwards, I get $199 at a 9% discount rate.
Disclaimer: This is not financial advice. I own shares in Google bought in June at around $170. I sold Google back in May last year to buy Microsoft since Chat GPT is definitely a threat to Google’s operating model. Since Microsoft’s valuation is now getting stretched, I took half of my MSFT stake and pushed it back into Google.
I feel like this is a chart that needs a temporal component, e.g. the 2015, 2020 and 2025 dots connected by arrowed lines. It’d be messier though.
nVidia riding high off renting the computers everyone’s AI is running off, after renting the computers everyone’s cryptocurrency was running off.
I wonder what group of suckers they’ll rent their CUDA cores to next?
We had planned on making this graph a quarter this size… Except, you know… *Tesla*
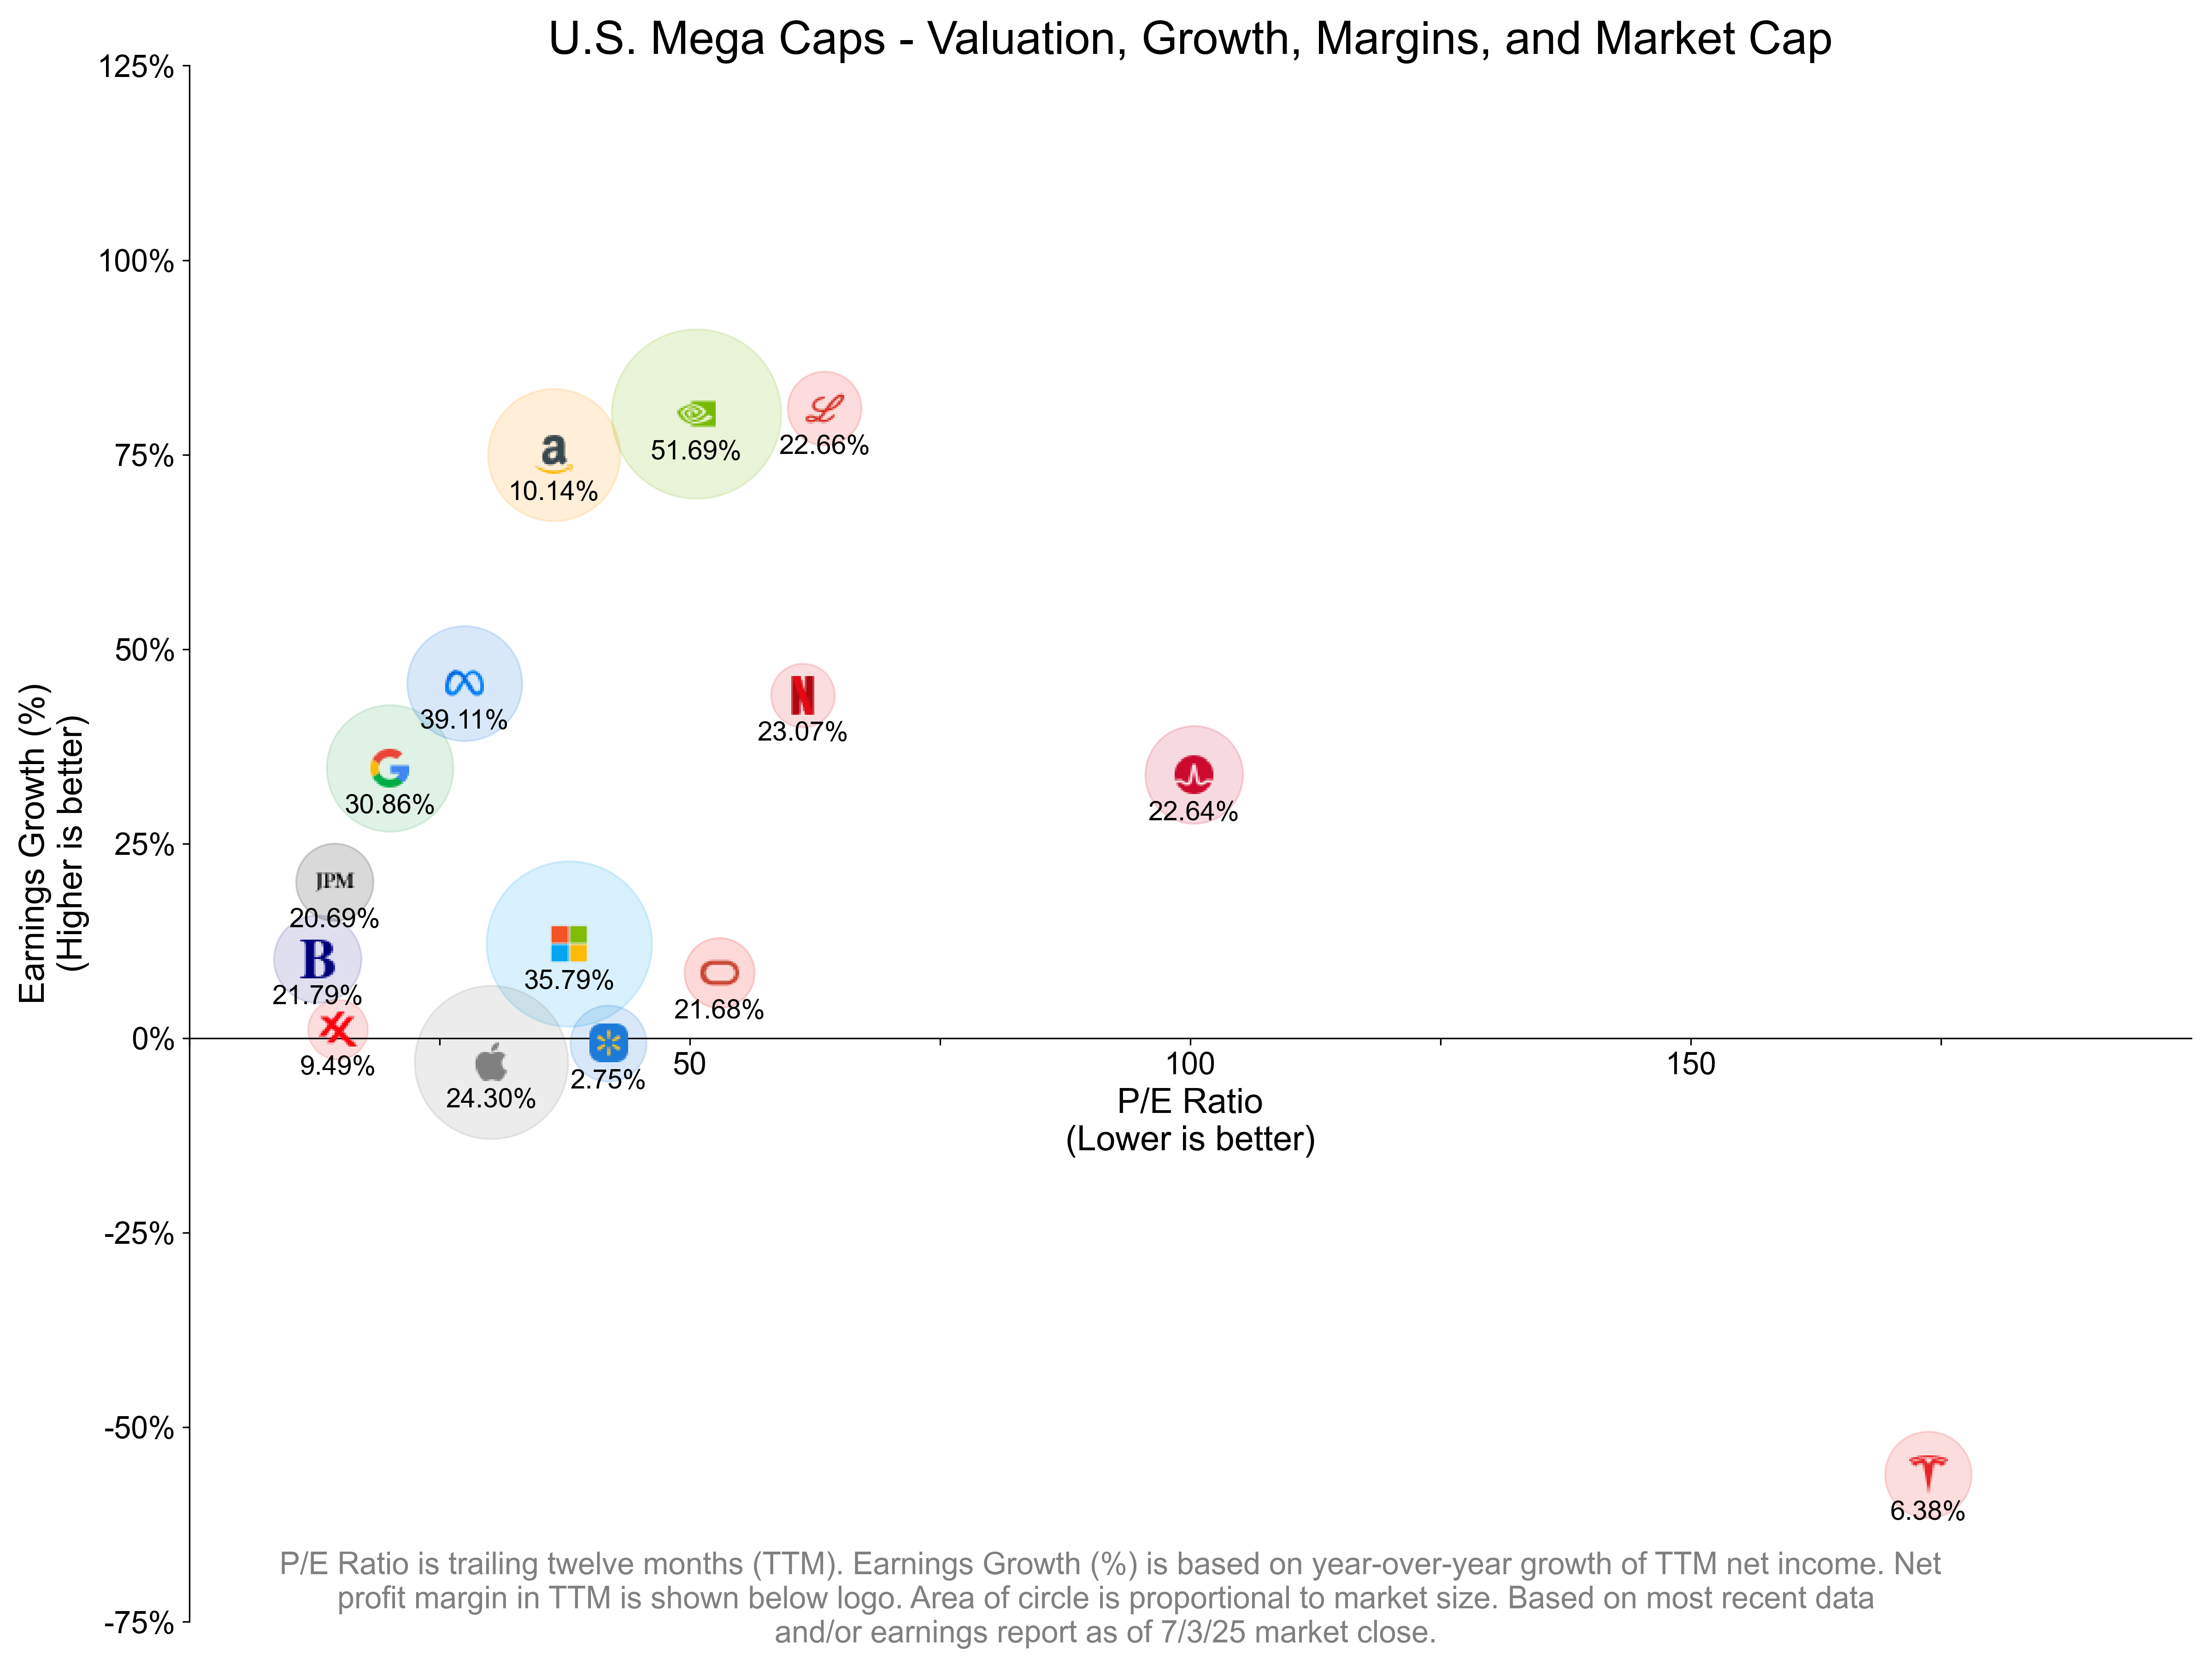
![[OC] U.S. Mega Caps - Valuation, Growth, Margins, and Market Cap](https://www.europesays.com/wp-content/uploads/2025/07/s3ydhq9v0taf1-1920x1024.png)
7 comments
This is an updated of an [older plot](https://www.reddit.com/r/dataisbeautiful/comments/1ijdqts/oc_magnificent_7_valuation_growth_and_margins/) I made depicting the valuation, growth, and margins for the Magnificent 7. Based on feedback from the last go-around, I’m depicting each company with a consistent logo size so that they can be easily visualized, since with the previous depiction, outliers such as Tesla were easy to miss. Instead, the area of the surrounding circle will be proportional to the company’s market cap. Net profit margins are annotated below the logos.
Additionally, I decided to include all 18 companies with a market cap exceeding $400 billion. However, as it turns out, some of the data points would cause the graph to be too congested–as such, V, MA, and COST are excluded, but all the data are shown in the table below.
| Ticker | P/E | Growth Rate | Net Margin | Market Cap (Billions) |
|:-|:-|:-|:-|:-|
| NVDA | 50.65 | 80.23% | 51.69% | $3,888 |
| MSFT | 37.95 | 12.13% | 35.79% | $3,708 |
| AAPL | 30.16 | -3.08% | 24.30% | $3,190 |
| AMZN | 36.44 | 74.99% | 10.14% | $2,372 |
| GOOG | 20.05 | 34.69% | 30.86% | $2,174 |
| META | 27.49 | 45.62% | 39.11% | $1,794 |
| AVGO | 100.36 | 33.85% | 22.64% | $1,294 |
| BRK.B | 12.81 | 10.18% | 21.79% | $1,036 |
| TSLA | 173.73 | -56.11% | 6.38% | $1,016 |
| JPM | 14.53 | 20.07% | 20.69% | $811 |
| WMT | 41.87 | -0.65% | 2.75% | $785 |
| LLY | 63.47 | 80.93% | 22.66% | $740 |
| V | 36.04 | 8.13% | 52.86% | $696 |
| ORCL | 52.97 | 8.38% | 21.68% | $667 |
| NFLX | 61.29 | 44.05% | 23.07% | $552 |
| MA | 39.92 | 10.96% | 45.21% | $517 |
| XOM | 14.86 | 1.14% | 9.49% | $484 |
| COST | 51.29 | 9.34% | 2.92% | $437 |
– Growth rate and net margin are obtained from Macrotrends for each company.
– P/E ratio and market cap are obtained using Microsoft Excel, as of 7/3/25 market close.
– Plot was generated using Python Matplotlib.
[deleted]
One of these things is not like the others
One of these things does not belong
I think Google is slightly undervalued. I understand that AI is a large threat to their search core business and that there are some litigation risks out there. However, they have done a decent job of diversifying their business into several strong platforms and their AI models seem to be decent. They have some best-in-class properties in Youtube, and Waymo which are still growing. I’m very bullish on Waymo especially.
Looking at Apple which has negative growth and is valued at 30 pe vs Google’s 20
Maybe the better comparable would be Meta 45.62% growth rate compared to 34.69%. 27 PE vs 20 PE. I think the core of Facebook is comparable to Google search. It’s growing but the numbers aren’t impressive and I suspect active users will decline in the coming years, especially in the North American region. NA is the highest ARPU (Average Revenue Per User) region ($68). Their userbase has been steady for the last 3 years but the younger demographic isn’t getting onto Meta’s apps that much.
Using 9.59 for Google’s 2025 EPS and a PE of 24 (conservative) we get $230.16 for what is IMO a low end fair value
Running a NPV with a 10% rise in earnings for the next 3 years, then a 6% growth rate (conservative) afterwards, I get $199 at a 9% discount rate.
Disclaimer: This is not financial advice. I own shares in Google bought in June at around $170. I sold Google back in May last year to buy Microsoft since Chat GPT is definitely a threat to Google’s operating model. Since Microsoft’s valuation is now getting stretched, I took half of my MSFT stake and pushed it back into Google.
I feel like this is a chart that needs a temporal component, e.g. the 2015, 2020 and 2025 dots connected by arrowed lines. It’d be messier though.
nVidia riding high off renting the computers everyone’s AI is running off, after renting the computers everyone’s cryptocurrency was running off.
I wonder what group of suckers they’ll rent their CUDA cores to next?
We had planned on making this graph a quarter this size… Except, you know… *Tesla*
Comments are closed.