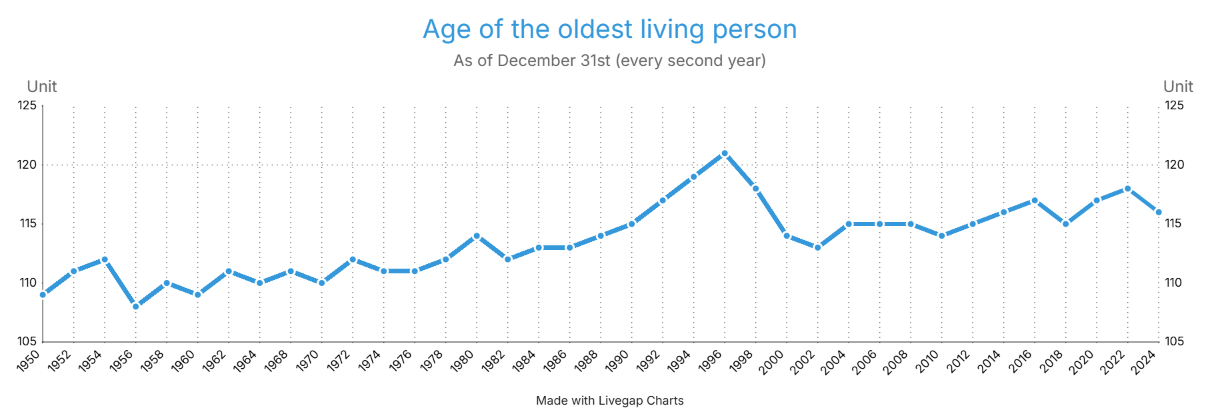
Graph made with Livegap charts (https://charts.livegap.com/), using this source material: https://en.wikipedia.org/wiki/Oldest\_people#Chronological\_list\_of\_the\_oldest\_known\_living\_person\_since\_1951
Posted by Tradition96
Graph made with Livegap charts (https://charts.livegap.com/), using this source material: https://en.wikipedia.org/wiki/Oldest\_people#Chronological\_list\_of\_the\_oldest\_known\_living\_person\_since\_1951
Posted by Tradition96
18 comments
Joining all the dots to make a continuous line chart is just confusing. The line should at least be separated by person, although no lines at all and using a bar chart would work just as well.
Very cool it shows how crazy 120+ is wow
If it would drop vertically at the time of one persons death to the next record holders current age it would be logical, but gradually falling makes no sense.
I wonder if the oldest living person was the same person from 1990 to 1996. Maybe even in general, which of these dots were the same person.
Edit: living… not loving…
If we look at the period from 1986 to 1996, how can the line change slope? Was the oldest person from 1986 to 1990 aging slower and the one from 1990 to 1996 aging faster?
The fact that there are different positive slopes is weird. I’m guessing you’re using exact age including days to plot?
I recommend two other plots:
One where you use only the age in years (i.e. 103 instead of 103.47)
One where you plot every day, using exact age including days, and make it a scatterplot instead of a line plot.
On average a rise of 1 year over a period of 10 years. ThatŌĆÖs quite steep in itself. Thanks for sharing.
Your Wikipedia link is bad, but I’m pretty sure that dependable birth records have been very suspect for the oldest people, and a lot of them like the attention they get for being super old so they often exaggerate.
You labeled the y axis… “unit”… Why
half of them were probably not as old as stated anyway. some of the nations the oldest person lived in had no proper documentation ~115 years prior. (which is in that timeframe most of the world)
I just want to point out that oldest person on this list Jeanne Louise Calment is not veryfied, as French goverment refused exhumation to confirm if rummors that it was her daughter were true or not. There is a big chance she lied and untill French goverment change its mind (unlikely) i would put her as unveryfied cathegory. And dont go to me with “BuT SHe Is VeRyFieD” she have a birth certyficate but for me there are way to many “holes” in her story so untill i have dna test i will not believe it and the fact France is avoiding it gives me colosal red flag.
This is peak r/dataisbeautiful
The oldest **verified** living person. Which requires at minimum a birth certificate, something the vast majority of the worldŌĆÖs population didnŌĆÖt have 120 years ago.
There are undoubtedly people alive today who are older than the official record holders, possibly by quite a margin.
There appears to be a correlation between high long living people and records destroyed by war.
Maybe that explains the peak in the ’90s
How tf does the slope of the graph increase at some points.
DonŌĆÖt look at the peaks, look at the lower points trending up quite fast in this time window┬Ā
The variable upward slops is so weird. Why on same years the oldest person ages at half the rate?
Places claiming to be centenarian hotspots may just have bad data
https://economist.com/graphic-detail/2023/09/28/places-claiming-to-be-centenarian-hotspots-may-just-have-bad-data
from The Economist
Comments are closed.