![[OC] Top U.S. Marginal Income Tax Rate vs. Inflation-Adjusted Federal Receipts (1901-2024) Absolute & Per Capita](https://www.europesays.com/wp-content/uploads/2025/07/21ueiv4jaabf1-1920x1024.png)
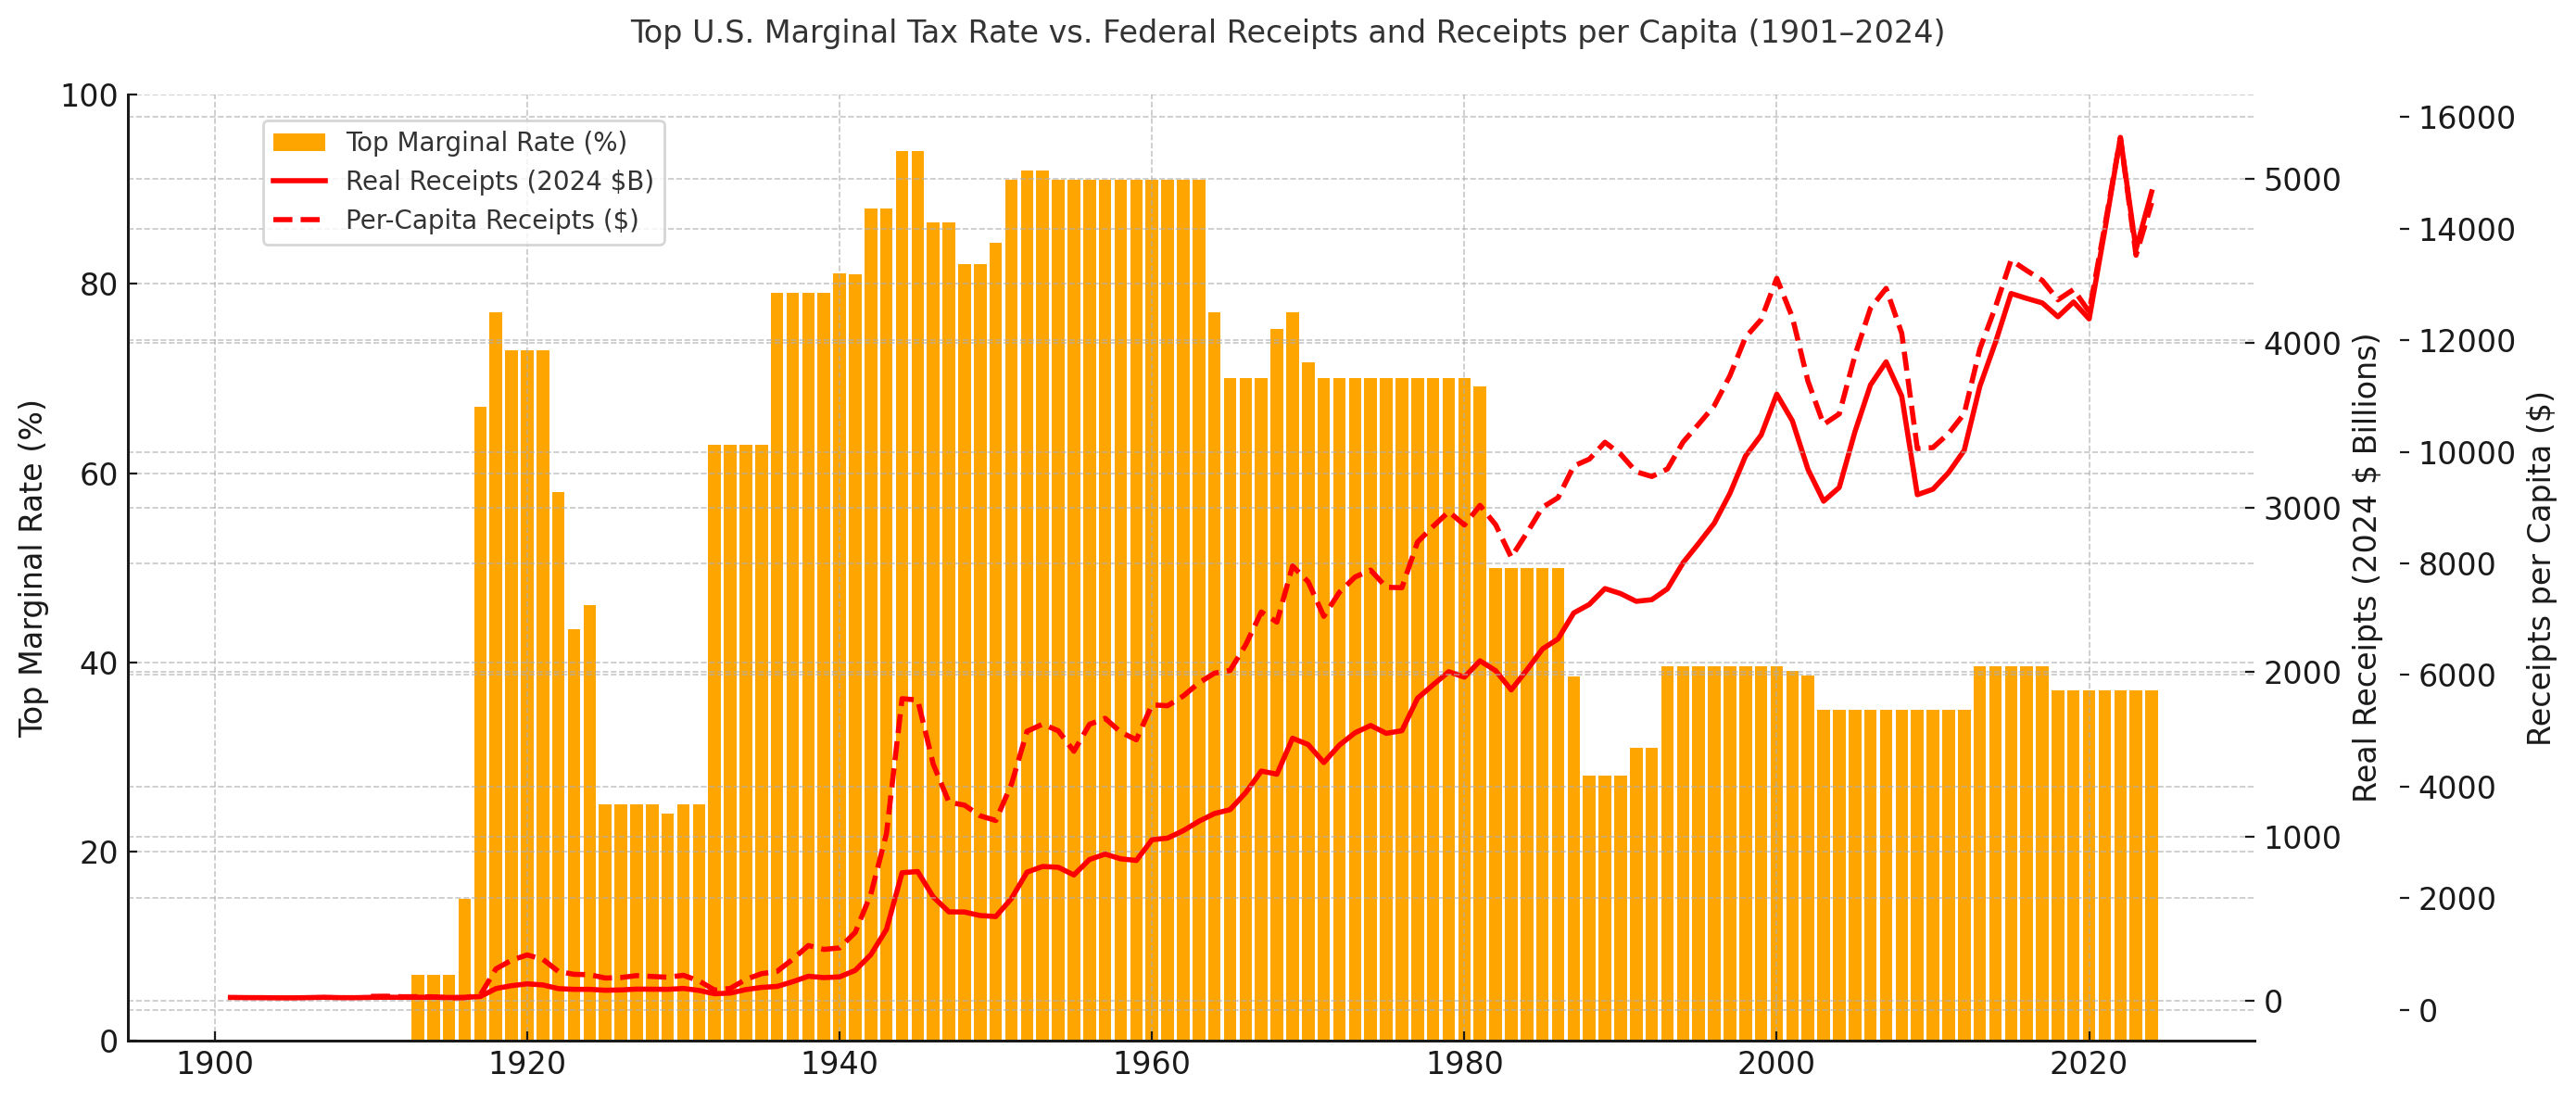
(Revised from this post to add per capita)
Marginal Rates:┬ĀTable Data – U.S Individual Income Tax: Tax Rates for Regular Tax: Highest Bracket
Inflation Adjusted Federal Receipts (in billions):┬ĀFRED – Federal Receipts (FYFR)
Population Data: Demographics of the U.S. (interpolated within decades)
Python (matplotlib.pyplot)
Posted by Mbando
14 comments
The closure between absolute and per capita receipts in the 2000s is interesting. The New York Fed shows [productivity in the US](https://libertystreeteconomics.newyorkfed.org/2024/07/the-mysterious-slowdown-in-u-s-manufacturing-productivity/) flattening and then declining starting in 2006.
https://preview.redd.it/yxobu7gkbabf1.jpeg?width=1840&format=pjpg&auto=webp&s=e6cb617778ca20fd60c5dc8c9dc3241638deebbf
**Edit: I thought this would be a bigger part of the picture but actually overall productivity is rising–my bad!.**
Am I dumb or is receipts the same thing as tax bill/taxes paid
It’s interesting to note that although tax rates have varied dramatically, in the postwar era tax receipts in the US have consistently been around [19.5% of GDP with mild variation](https://en.wikipedia.org/wiki/Hauser%27s_law). There’s a lot of possible reasons for this, but a major one is that the reduction of top marginal income tax rates was accompanied by reductions in a lot of deductions and loopholes that meant almost nobody actually paid 90% rates.
Also people using capital gains to offset their “income”. Taking payouts in stock to avoid income taxes. I’m sorry if your capital gains are greater than your income…the capital gains are your income and should be taxed at the income rate.
3 y axes is not beautiful data, it’s unreadable data.
I would love for someone to make a better chart of this, perhaps by showing annual % changes in each value or a 5 year moving average.
This is a well known phenomenon called the laffer curve. It is shown here.┬Ā
Would it be possible to add a line for per capita for either the highest tax bracket or top 1%?
Now do receipts MINUS interest payments.
It makes no sense to post this over and over again. The point is if we kept the high marginal rates and removed the ridiculous deductions that were allowed in the past we would have nearly 0 debt. The problem is we are trying to balance a budget on the backs of the working class. Who pays the most in taxes? High income. Who pays thr least? The poor and the wealthy. Why are capital gains taxed massively lower than income not only do they have a ridiculously low tax rate they also dont pay any fica taxes which is a massive reduction as well. Max of 20% for capital gains is disgusting its less than someone would pay making 48k-100k.
Capital gains taxes should be significantly higher than income tax. It requires no effort or time. They get to deduct the cost of the capital and only pay on the profits. While someone who slaves away barely making ends meet is paying the same if not higher rate.
Wild that youŌĆÖre not adjusting for price inflation
You can see right there in the latter third where Reagan powered up by the southern strategy kicked us in the dick.
Notice that the most successful years for the United States were when this tax rate was the highest?
We need to focus a lot more on the 0.1% and 0.01%. Taxes that impact people merely in the 1% draw a lot more opposition.
why don’t you also show the share of the income and capital gains going to the top 1%?
the rich don’t pay this rate. They make their money from capital gains which is taxed at 15%
Comments are closed.