Methodology:
- Median Age: Indexed from when each country hit age 35 (China in 2013, Japan in 1986)
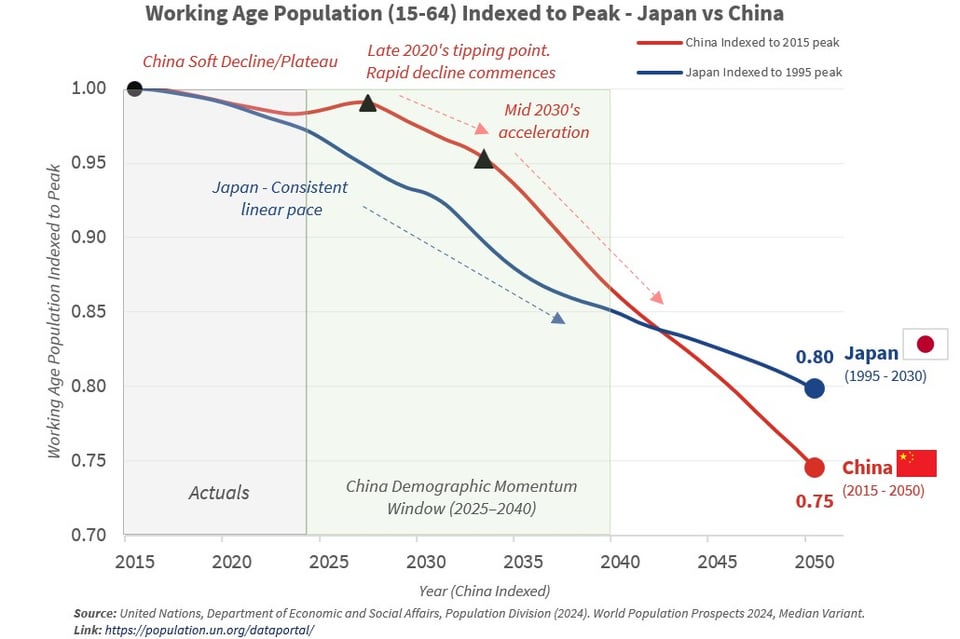
- Working-Age Population: Indexed from each country’s peak (China in 2015, Japan in 1995)
- Source: UN World Population Prospects 2024 (Median Variant)
- Made in Excel
Posted by Mido_Aus
6 comments
**Methodology:**
* **Median Age**: Indexed from when each country hit age 35 (China in 2013, Japan in 1986)
* **Working-Age Population**: Indexed from each country’s peak (China in 2015, Japan in 1995)
* **Source**: [UN World Population Prospects 2024 (Median Variant)](https://population.un.org/dataportal)
* Made in Excel
Are demographic charts really that predictable or there is a mandate of heaven that can save China?
The US could win the economical war by just waiting, but they chose not to
I’d rather see it as a fraction of total population.
I lost 2 lbs over the last two days. Let me guess, I would be 0 lbs within the year? 😀
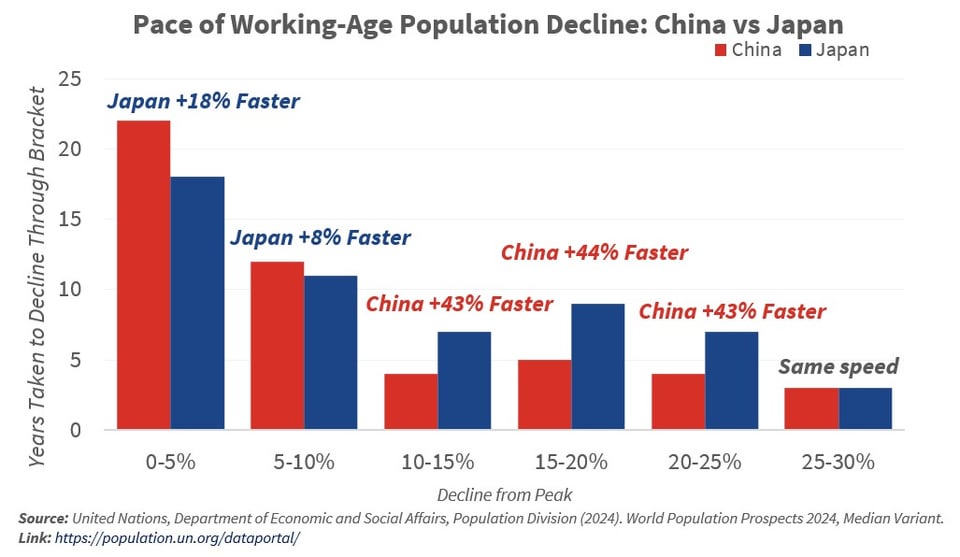
The rate of decline, depends on very small differences in fertility rate
China will decline as fast as Japan if their fertility for the next 75 years ends up at 1.3 instead of 1.1
And it would decline slower with even a further slight increase
The opposite is also true, at these scales, even very very minor changes in fertility rates have huge effects, and you can’t predict if in 2040 China will be at 1.0 or 1.2
Comments are closed.