
TLDR
Dogecoin surged 6.2% from $0.197 to $0.209 between July 16-17, reaching a peak of $0.22
Trading volume exploded to 1.22 billion tokens at 21:00, nearly tripling the daily average
DOGE overtook TRX to become the eighth-largest cryptocurrency with a $30 billion market cap
Technical analysis shows a double bottom formation and cup-and-handle pattern on key timeframes
Market appears positioned for genuine altcoin season with USDT dominance flashing top signals
Dogecoin experienced a sharp price rally over the past 24 hours, climbing 6.2% from $0.197 to $0.209. The meme coin reached a peak of $0.22 during the most active trading period.
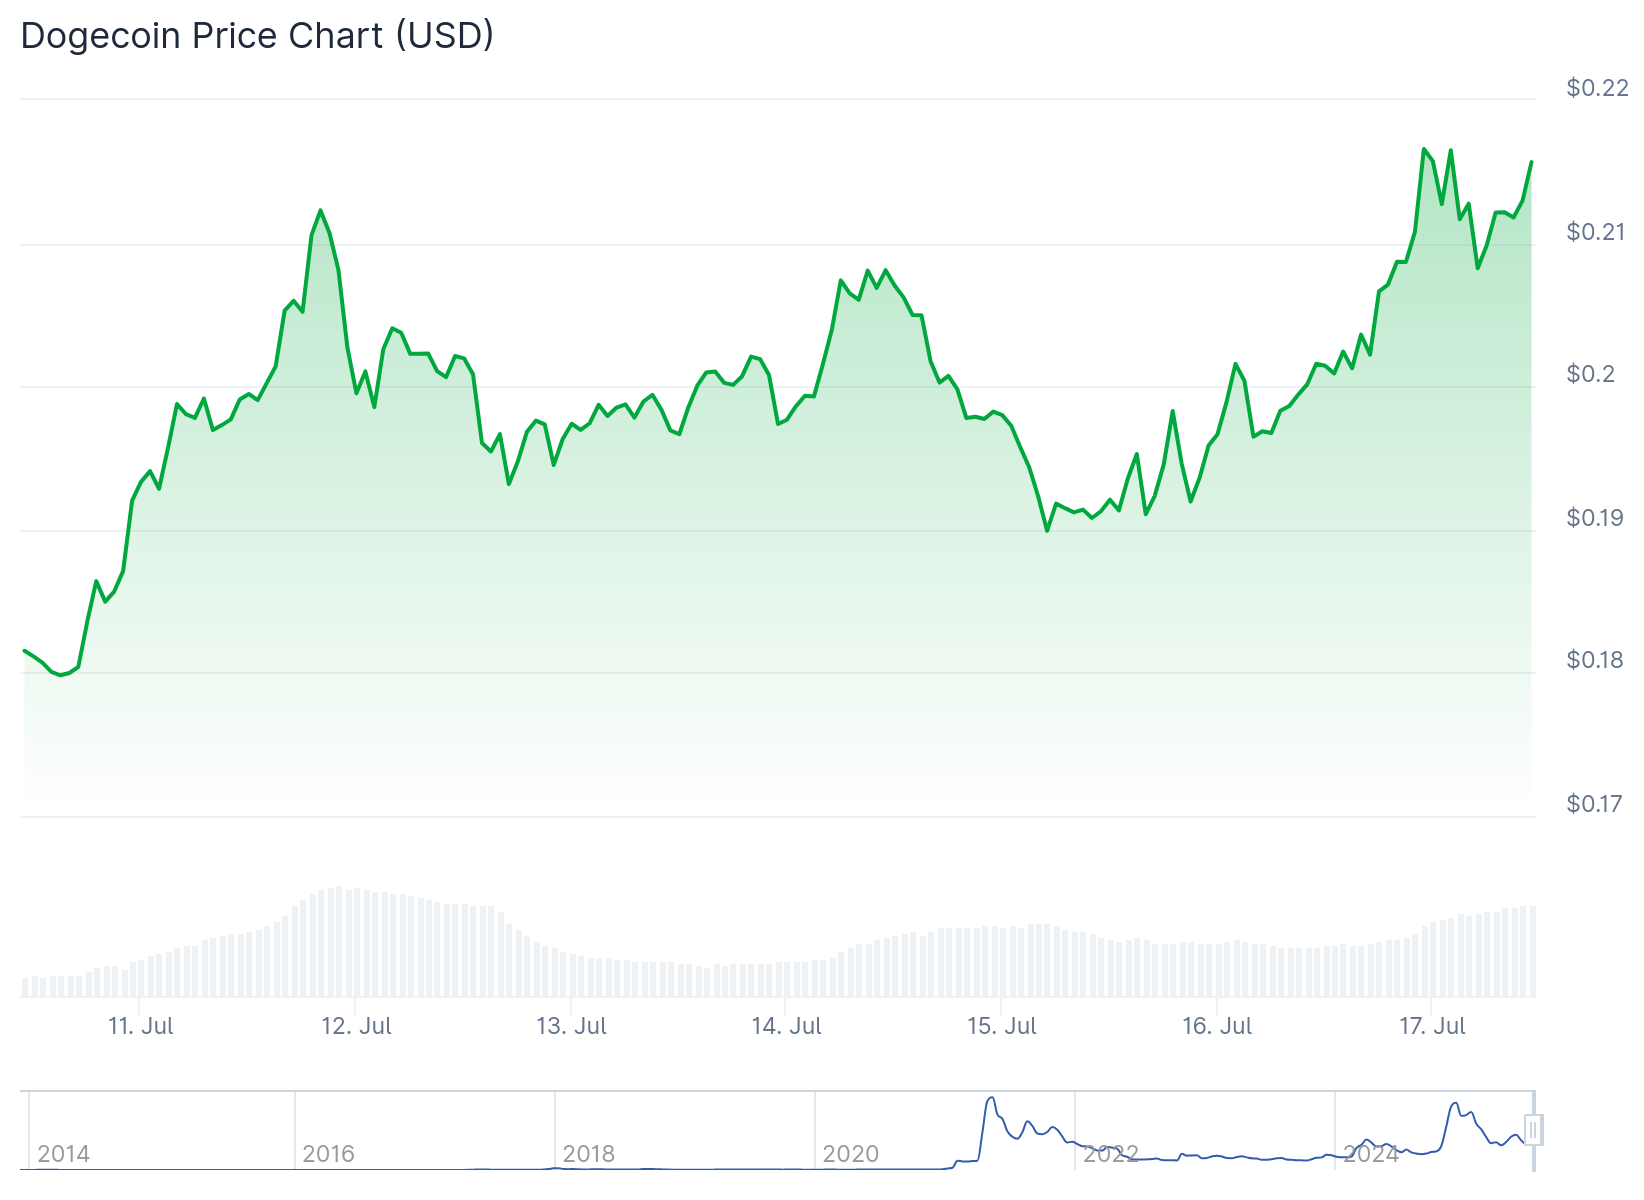
Trading volume surged to 1.22 billion tokens at 21:00, marking nearly three times the daily average of 490 million tokens. This volume spike represents the highest levels seen since March.
The price action allowed DOGE to overtake TRX and claim the eighth position among cryptocurrencies by market cap. Dogecoin now holds a $30 billion market capitalization.
Technical Patterns Point to Continued Upside
Technical analysis reveals multiple bullish formations across different timeframes. A double bottom pattern has formed on the 2-week chart, positioned along the 2024-25 uptrend and sitting directly above a multi-year downtrend line.
On shorter timeframes, an 8-week cup-and-handle pattern is developing on the 4-hour chart. Price action is approaching a breakout above the descending channel that forms the handle portion of the pattern.
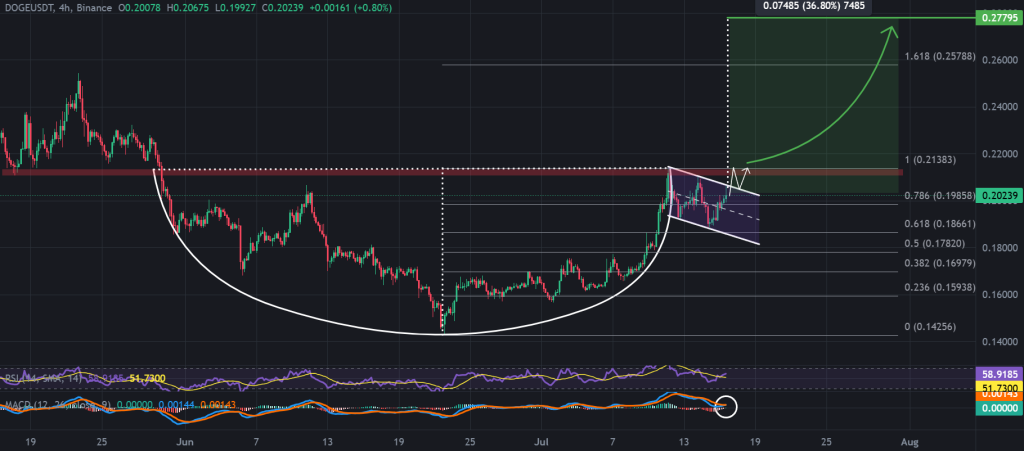 Source: TradingView
The RSI indicator shows strength at 58, suggesting buyers are controlling the current move. The MACD line is nearing a golden cross above the signal line, indicating a potential near-term uptrend.
If the cup-and-handle pattern completes, it projects a 36% move higher to reclaim $0.278. This would represent the first step toward higher price targets.

Key resistance sits at $0.21, which matches the local range high. A clean break above this level would confirm a full breakout from the current pattern.
Altcoin Season Momentum Building
Market conditions appear favorable for broader altcoin strength. USDT dominance charts show signals of a local top, suggesting capital may rotate back into higher-risk altcoins.
The Stochastic RSI has breached overbought conditions alongside a key retest of resistance trendlines. This technical setup suggests the ongoing uptrend in dollar dominance may reverse.
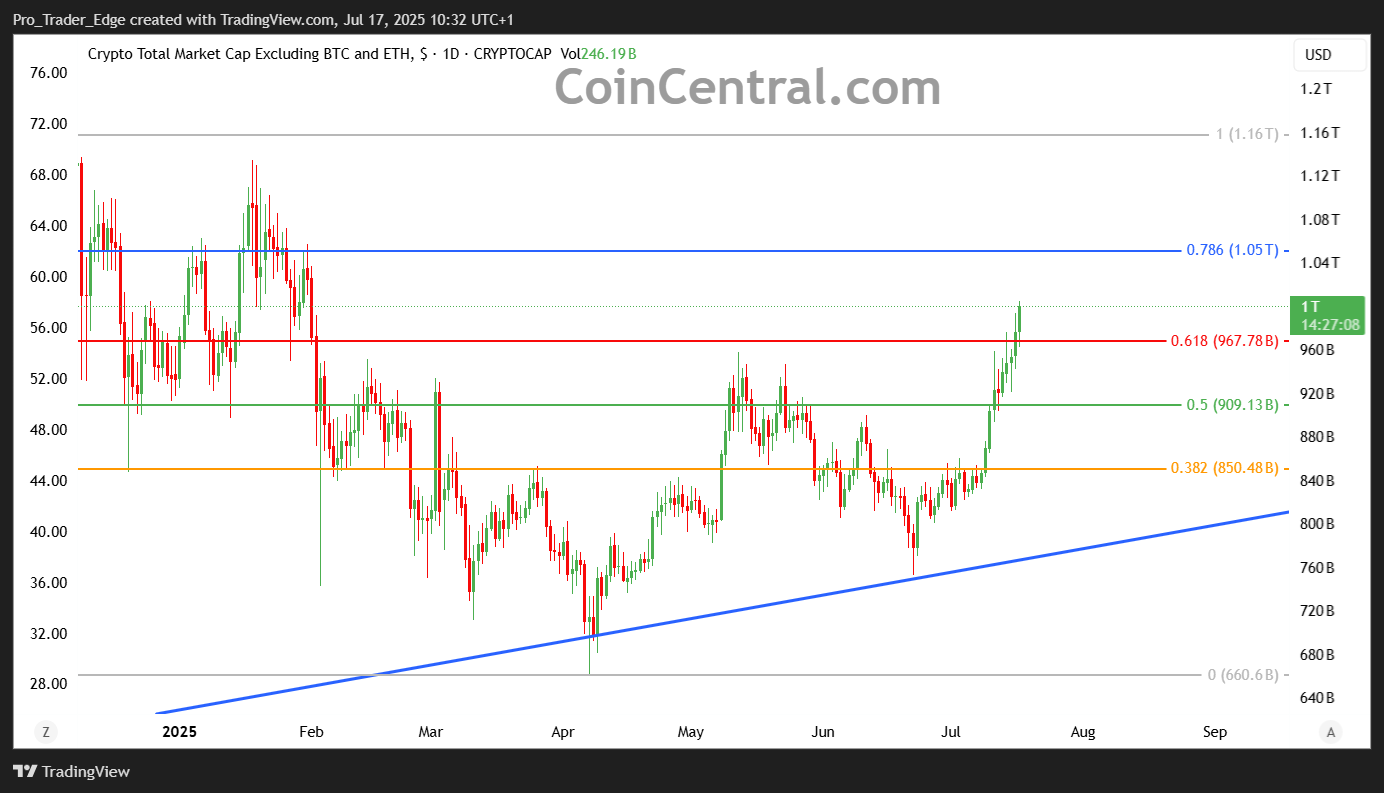 Source: TradingView
Altcoin market cap charts show a retest of key resistance at $986 billion. This confluence builds a case that the market sits on the verge of genuine altcoin season.
Institutional volume clusters occurred between 14:00-21:00, supporting trend continuation if the $0.208 level holds as support. The final hour saw a 0.96% rally from $0.207 to $0.209, with volume surging to 19.03 million.
Market watchers attribute part of the rally to fund rebalancing following XRP’s ETF-related movements. Dogecoin’s liquidity and social virality make it an ideal target for institutional momentum strategies.
Support levels have been confirmed at $0.207-$0.208 through repeated intraday bounces. Strong selling pressure emerged at $0.22, with rejection visible during the 21:30-22:15 window.
Trading volume data shows the breakout over $0.201 was confirmed with triple-volume activity, lending credibility to the move.