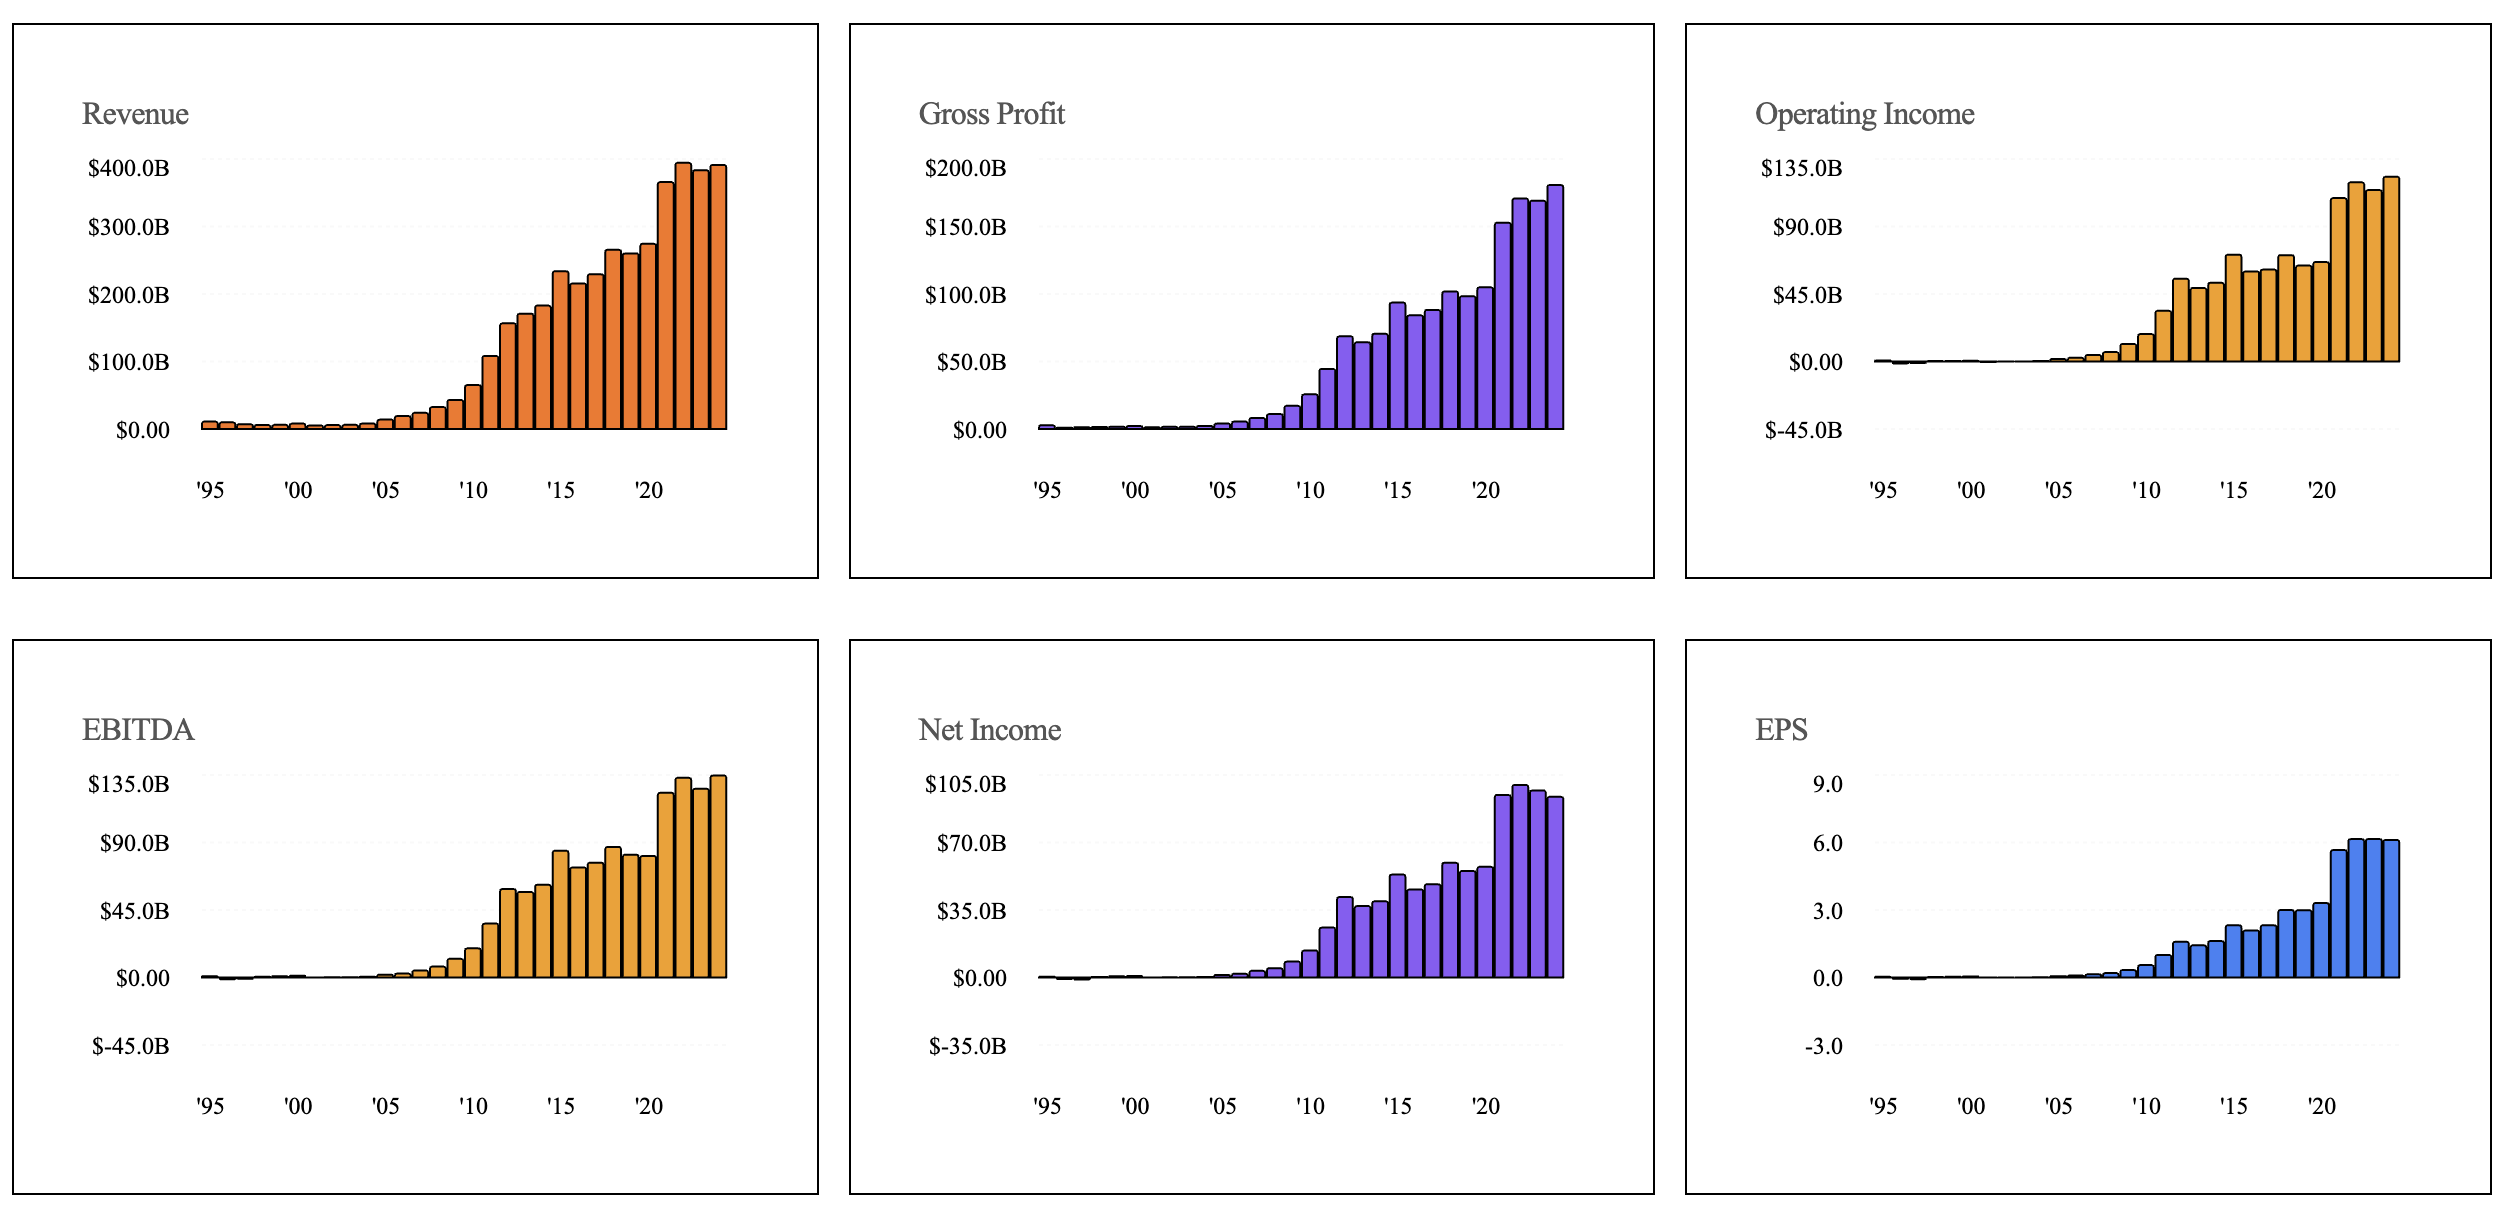
Data sourced via the Financial Modeling Prep API.
Visualized using a custom tool I’m building for analyzing public companies.
Posted by OkiVol_Blog
![[OC] Apple Financial Metrics from 1995 to 2025, Visualized in 6 Charts](https://www.europesays.com/wp-content/uploads/2025/08/e9e37312hrgf1-1920x1024.png)

Data sourced via the Financial Modeling Prep API.
Visualized using a custom tool I’m building for analyzing public companies.
Posted by OkiVol_Blog
1 comment
Feel like a logarithmic y-axis would have made more sense.
Comments are closed.