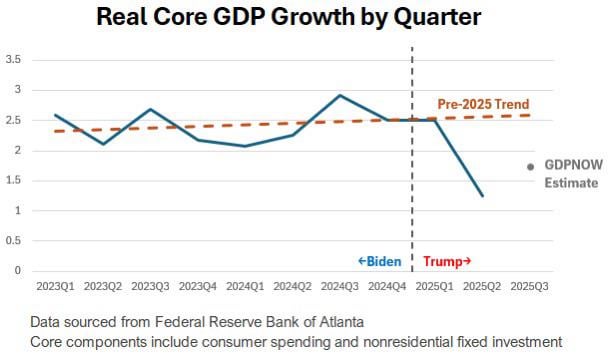
I think this will be a more accurate way to assess the growth effects of Trump’s policy for 2025 at least. I created this in excel.
Posted by TheoryofJustice123
I think this will be a more accurate way to assess the growth effects of Trump’s policy for 2025 at least. I created this in excel.
Posted by TheoryofJustice123
14 comments
Is this GDP just without the (X – M)?
I am convinced that if weren’t for the AI data center boom, we’d basically be in a depression already.
Now start at 2022 when we had 2 consecutive quarters of negative GDP growth.
Cherry picking, why not start at 2020? 2022 was shitty
Lmao classic Reddit fashion.
Completely changes what the actual GDP growth metric is because they make up a way to make it look worse. Also don’t include relevant years to make their chart further demonstrate their propagandistic point. Finally top it off with the insinuation of comparison between administrations but deny this fact in the comments.
Then post their line graph to data is beautiful.
Absolutely pathetic and delusional lmao
I agree there is a difference between Biden and Trump here, but I am confused by the trend line. The Biden trend line going up doesn’t make sense to me if the blue line is starting above 2.5 and ending his term at or below 2.5. Am I misunderstanding this?
Of course, this is fake news. Right? Second quarter GDP was up like 16 to 25%. Some are saying it was even higher than that. 🤡
Looking at 11 quarter seems like over-fitting. Looking back at the past 25 and ignoring the two >20 quarters only 21 of the 94 quarters are outside 1 SD.
This was not scribbled on with a sharpie to make Trumps portion go through the top of the chart! FAKE NEWS!!1!
OP made a graph of government spending and is making it sound like a bad thing xD
Careful, posting data that Trump doesn’t like has historically caused a loss of employment.
GDP was 3.0 for q2 what is this
Time to sack another statistician
This is a witch hunt, a hoax by the loony left, also you’re fired!
Comments are closed.