![How an ACL tear changes an NFL player's career [OC]](https://www.europesays.com/wp-content/uploads/2025/08/l0aw6q86mjif1-1920x1024.png)
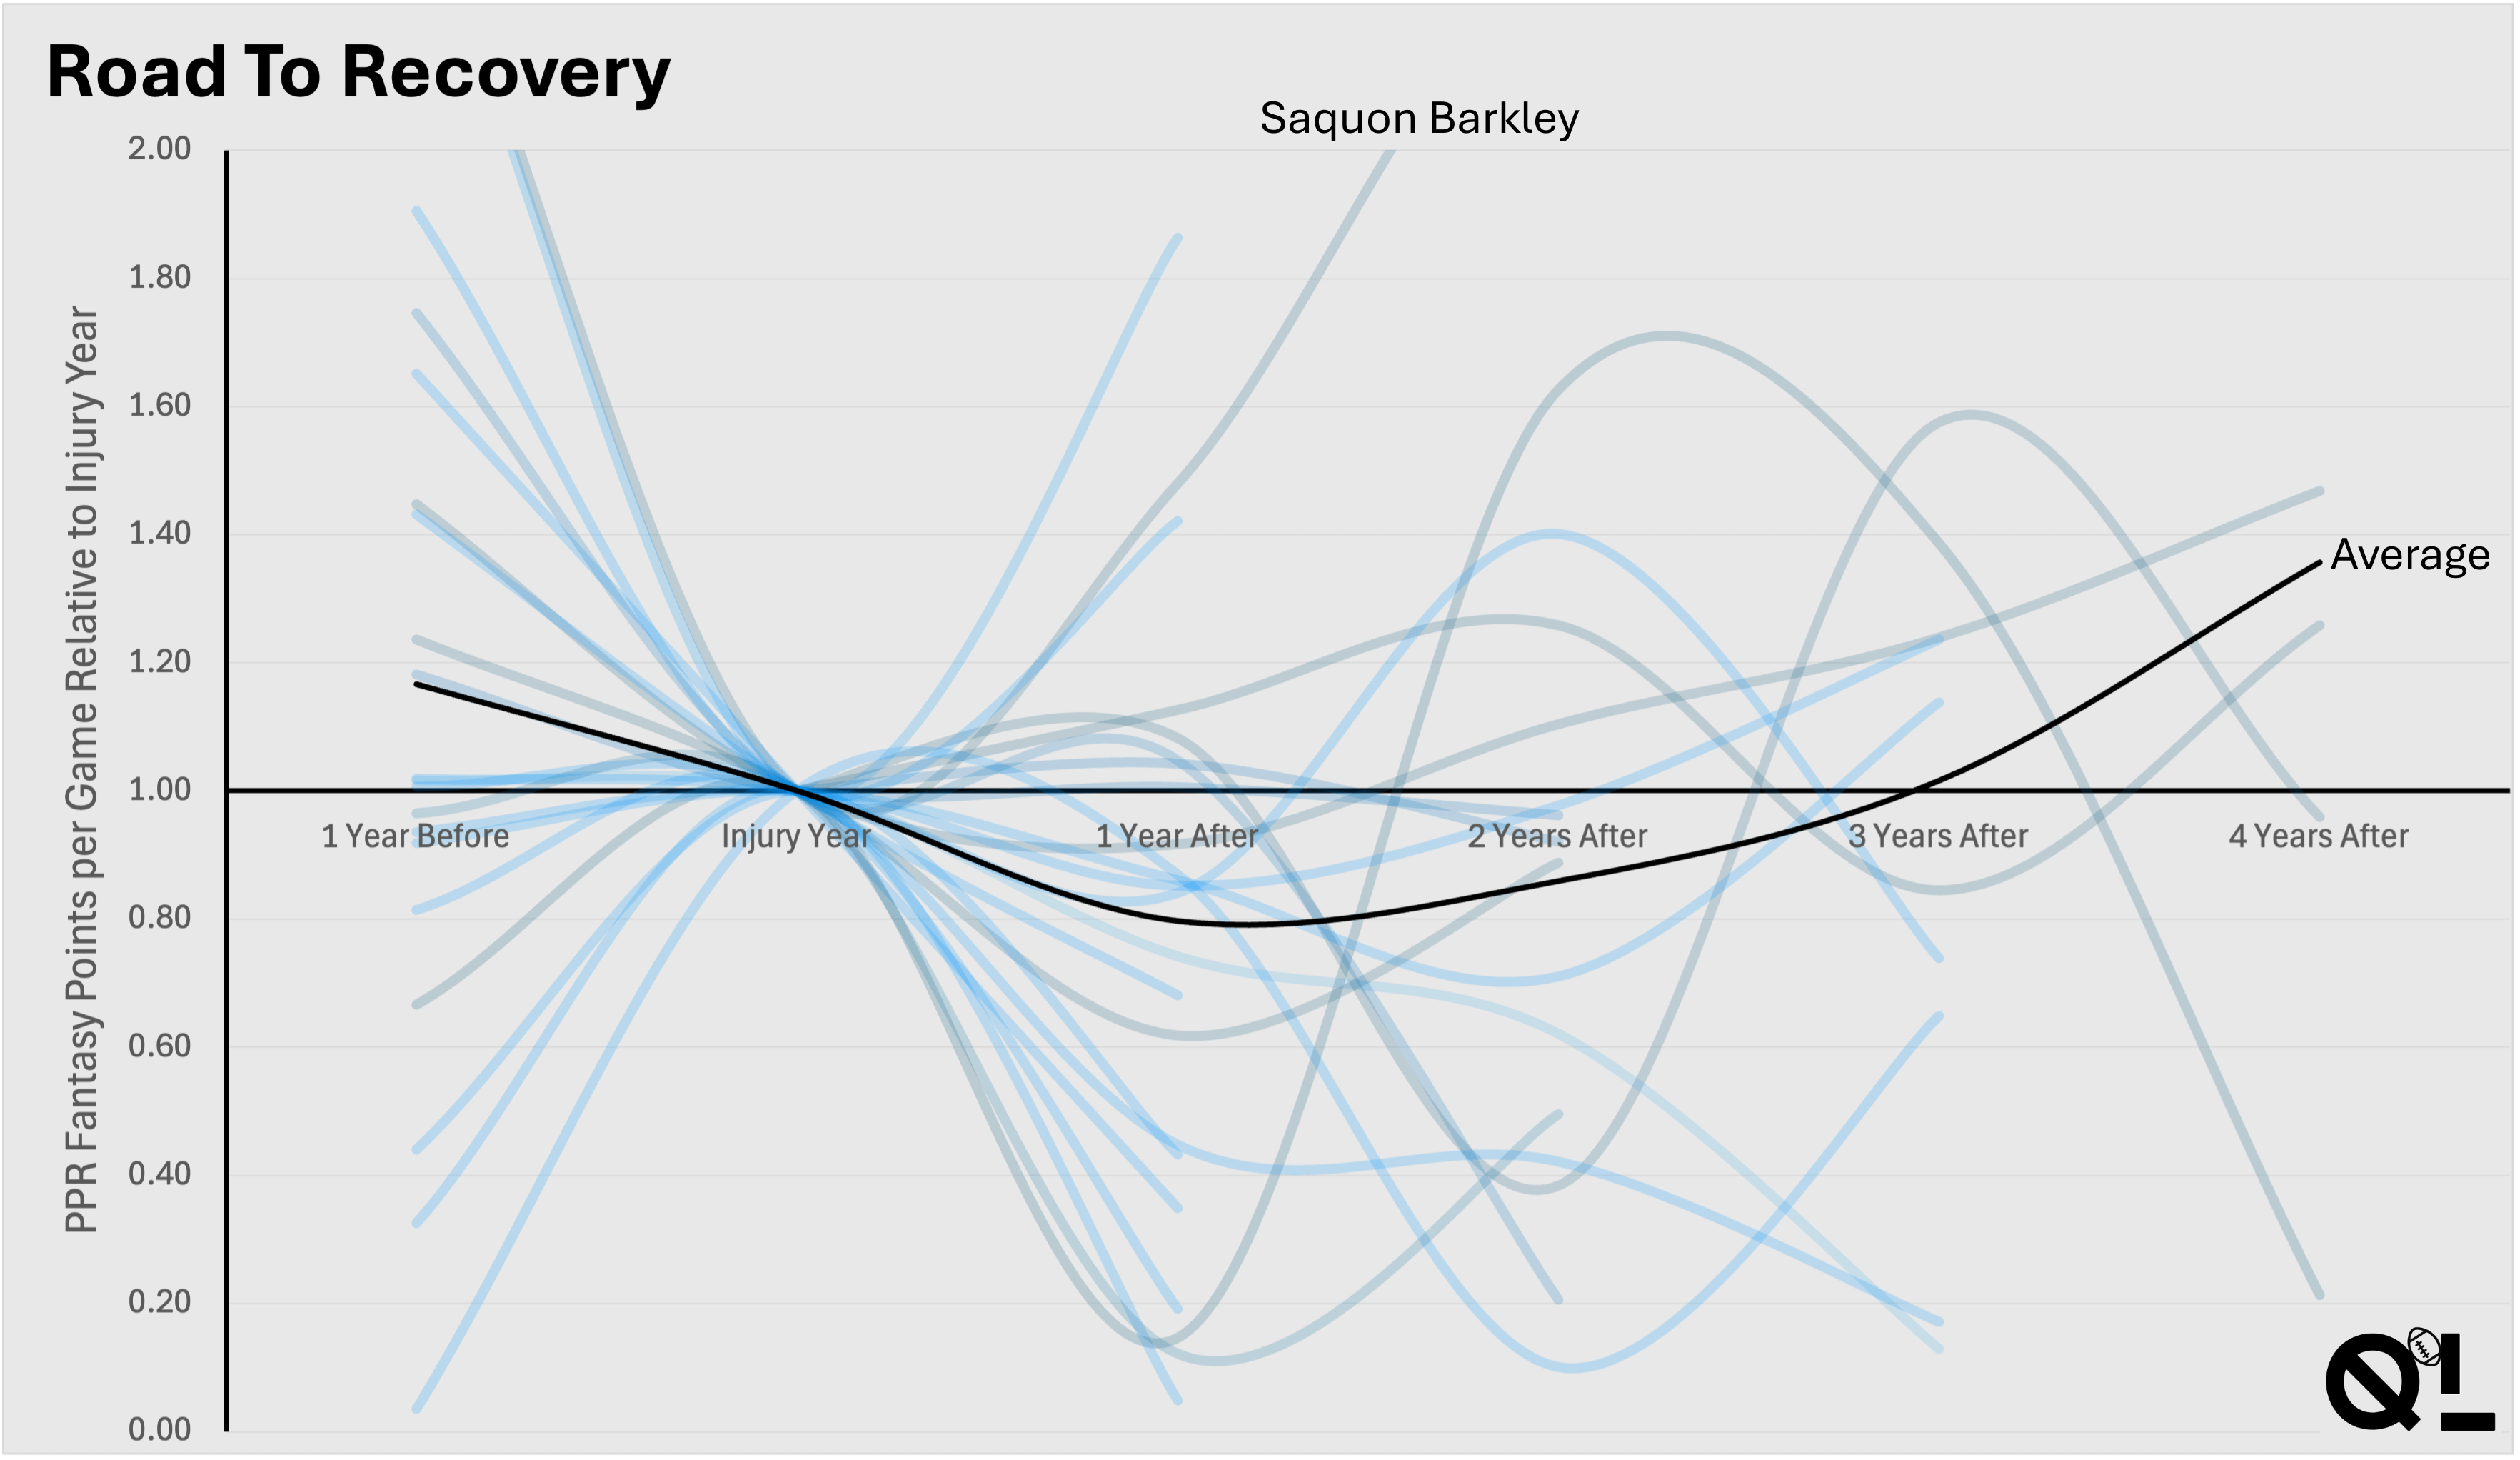
This shows fantasy points per game (a proxy for performance) relative to injury year, as an index. If you're at all interested in statistics in sport (specifically American football), consider checking out my article! https://fantasyfootballquantlab.substack.com/p/injuries-and-the-acl
Posted by FFQuantLab
25 comments
I see a plot depicting points over time. Grey and blue lines go up and down and all cross the one point line at the same x axis point in time. There is a black line for the average.
I do not see where any of these lines go after the injury year since they all have the same colour scheme.
I learn nothing from it.
I suggest clustering all lines starting from 0-0.5, 0.5-1, 1-1.5, 1.5-2 and show the average from them in different colours
Does each line represent a specific player? Why are the lines so smooth? How did anyone managed to tear an ACL and get better within the first 6 month!?
I don’t get much from this either. Where is the actual data points on this, is it at the year marking and spline between them?
It would be interesting to compare people with similar data before the injury to people that didn’t get injured. What impact did the injury have, compared to people with similar career without the injury?
It’s honestly a miracle what they can do with acl surgery now a days. In the past, that was a walk with a cane for the rest of your life type injury. Now, it can be fixed and people can go on to live normal, non debilitated lives.
That black line average curve? Doesn’t seem right. Because if 75% dipped out to never come back and 5% climbed high to just crash doesn’t make a middle road.
So many lines ended a year after injury. Does that mean they played 1 more year and they’re done?
As a professional data analyst*, I’d like to share a couple comments based on the data presented here.
1. If you’re an NFL player, you want to avoid tearing your ACL.
2. That’s unless you’re Saquon Barkley, who clearly ought to tear his ACL on the last play of every season.
*Not really a professional data analyst.
It’s interesting, without a doubt. But I leave with more questions, and I am not a paid member, so I can’t read the article.
As someone who likes data but has zero interest in NFL, it does not really explain enough for me to understand the consequences of an ACL-rupture. But here’s my questions/notes:
Not being able to differentiate the lines makes it incredibly difficult to decipher.
I assume the curves aren’t factual? Since a few people seems to have slightly better stats right after the tear? Straight lines ‘might’ be better for accuracy (or depiction of resolution). But not important. Just a note.
A baseline would be great to understand the impact. Not the “average recovery”, as depicted. How does the average healthy players stats compared to this? This would require that we can determine an average year in which the players get said rupture (so we can anchor it to the injury year), but I think it is somewhat required to understand the “average”. For all I know, ruptures happen at the late stages of careers, where people tend to stop (play worse) anyway. But yet again, not an important note.
My key question is however:
Right now, it reads as a rapid career ender, with a borderline random outcome if you get through it.
… the average line does not depict that. Considering only four people made it to year 4 (maybe five; whoever that Saquon dude is, he’s off the charts). So we can assume the rest essentially went to zero; after two to three years.
The rest being filtered out kinda means it’s not an average prognosis. It’s the average progression IF you make it that far. The true prognosis for the 14+ other people is a lot worse than the average depicts. But again, I don’t know how it compares to an average NFL player. Maybe they stay 6 seasons instead of 3. Maybe they don’t.
Interesting nonetheless. I wrote all these words because of it, so thanks for the graph.
What about this data is beautiful
This graph has an enormous survival bias.
Looking at it it seems that on the long term break your ACL is a good thing, but in reality it’s the end of most career.
It’s complicated to make a good graph out of this because probably you should consider position, age of the player and I don’t know what else and compare it to players who haven’t been injured
How does this relate to a player that hasn’t torn their ACL? This is kind of meaningless in a vacuum as it’s very unclear what impact the injury has Vs not having the injury
There seems to be a lot of suvivorship bias in the average going up in year 3. So many players have big dips in year 1 after the tear and stop playing.
This data is so varying that the average seems to be not telling the entire truth about the sheer uncertainty? The average doesn’t even align to any particular injury here. I think one would be better off leaving out the average because the data set is so wildly varying.
You smoothed the data and gave a smoothed average line when the majority of the data points don’t make it past the 2 years after?
Sorry mate but this is a bad graph
Survivor bias. Players who are playing well are more likely to still in the league three years after the injury.
“Average” (of the players whose careers haven’t ended)
Fantasy points is a terrible measure for a myriad of reasons
This data is not really good to interpret without the knowledge of what the average increase in Fantasy Points (FP) is without injury. Especially given the fact that the upwards slope of the average at the end is obviously survivorship bias.
I think a better metric would be:
FP(injured)/FP(uninjured)
while the FP(uninjured) takes the average age of the injured players as the starting point.
Using injury year as the baseline creates some noise in the data: if a player gets injured week 1, they’ll have far different baseline vs week 16. Why not use their best pre-injury year as the baseline? That would create an easier to understand narrative around “recovery”
It’s probably not a bad idea to scale these all by age to follow the general aging curve of a player’s respective position, to differentiate between what guys’ declines are at least in part simply due to age
Would love to see this by position. OL is gonna trend way different than DB or RB. Curious how WR is afffectsd
This data is in fact, beautiful.
Saquon was my first RB pick after his injury year and people thought I was mad. In reality, I didn’t realize he had the surgery. He helped me win my fantasy league that year ahaha.
So injuries are bad, mostly? Damn
As someone who plays Fantasy football. I am immensely confused by the points per game going from 0 to 2 points.
Saquon averages 22 points last year.
Comments are closed.