A 10% random sample of enrollees within the PharMetrics Plus data from 2016 to 2020 was utilized. Data contributors to the database are largely commercial health plans. It is representative of the commercially insured US national population for patients under 65 years of age. It contains a longitudinal view of inpatient and outpatient services, prescription and office/outpatient administered drugs, costs, and detailed enrollment information. All data are compliant with the Health Insurance Portability and Accountability Act to protect patient privacy.
We also utilized the SEER-Medicare data from 2016 to 2019. SEER Registries collect data on cancer cases in the US, including demographics, primary tumor site, stage at diagnosis, treatment and death information. Medicare is a federal health insurance program in the US for people age 65 or older and people with disabilities. The database includes individuals represented in the SEER Registries and in the Medicare 5% sample. The SEER database collects clinical and demographic information while the Medicare data provides information for reimbursed use of hospital, physician, outpatient, home health care, hospice, and Medicare Part D services.
The primary difference between the populations represented in the PharMetrics Plus and the SEER-Medicare is that PharMetrics Plus primarily includes individuals with employer-sponsored insurance and thus are of working age, whereas SEER-Medicare consists of retirees aged 65 years and older. As such, social factors related to occupational exposure may be more prominent in the PharMetrics Plus population whereas social factors related to primary support groups may be more influential in the SEER-Medicare population.
Data on area-level SDOH factors were retrieved from PolicyMap and linked to the individual-level data. The PolicyMap database includes over 50,000 gold-standard public indicators such as economic, housing, transportation, and quality of life data for 2009 to 202035. PolicyMap aggregates area-level data from a range of authoritative public and private sources, including the US Census Bureau, Census County Business Patterns, the Department of Health and Human Services’ Agency for Healthcare Research and Quality, the Federal Financial Institutions Examination Council, and the Office of Community Planning and Development, among others36. Guided by prior literature and the Behavioral Model for Vulnerable Populations37, six measures were extracted from the PolicyMap database: out-of-pocket medical costs, food insecurity rate, fast-food restaurant rate, homeless population, home loan application denial rate, and subsidized housing rate. The 2019 measures were extracted at the state level (the smallest geographic area that was common to both the PharMetrics Plus and SEER-Medicare datasets) and linked using the state of residence at the time of enrollment (PharMetrics Plus data) or cancer diagnosis (SEER-Medicare data). Detailed information about how PolicyMap measures were extracted and mapped with the aspects of the Behavioral Model for Vulnerable Populations is provided in Appendix G. Using only the SEER-Medicare data, additional PolicyMap variables were extracted at the county-level. A table of characteristics of the study population including county-level information is provided in Appendix F.
Data pertaining to oncologists’ understanding and opinions regarding Z-Codes were collected from a convenience sample of oncologists and hematologists who actively participate in the Cardinal Health Oncology Provider Extended Network (OPEN). OPEN is composed of more than 7,000 medical oncologists, hematologists, and urologists who engage with Cardinal Health in clinical research, market research, live summit meetings, and/or real-world research opportunities. Practices in the OPEN database cover all four US regions (25% Northeast, 14% Midwest, 25% South, and 36% West). During the Summit meetings, responses to Z code questions were recorded via an online audience response system (ARS). Participants were encouraged but not required to answer all ARS questions. Participants were aware that the results would be presented in aggregate only.
This study protocol was reviewed by the University of Maryland, Baltimore (UMB) Institutional Review Board (HP-00098764) and determined to be exempt under 45 CFR 46.104(d). The UMB Institutional Review Board (IRB) approved this study as secondary research for which informed consent was not required. Consistent with UMB IRB regulations, if information is collected in such a manner that the identity of study participants cannot readily be determined, there is no direct contact with study participants, and there is no attempt to re-identify study participants, then informed consent is not required. This study met these criteria, and the UMB IRB granted approval to waive the need for informed consent. All study procedures were completed in accordance with the applicable UMB Human Research Protections Program and IRB guidelines and regulations. The STROBE (Strengthening the reporting of observational studies in epidemiology) checklist for cross sectional studies was utilized and completed for this study.
Claims data: study population
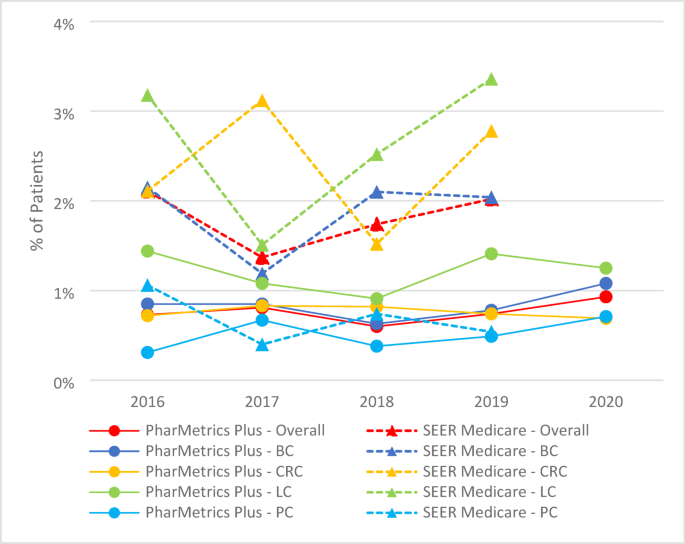
Using the PharMetrics Plus data from 2016 to 2020, we included individuals with continuous enrollment for the full calendar year (January 1 through December 31), assessed separately for each year. Among individuals with continuous enrollment, we identified those diagnosed with one of the following four cancer types: breast cancer (BC), colorectal cancer (CRC), lung cancer (LC), or prostate cancer (PCa). Individuals were defined as having a specific type of cancer if they had either at least one hospitalization or two outpatient visits with ICD-10-CM diagnosis codes for the same cancer type, recorded within the same calendar year in which they had continuous enrollment (see the Appendix A for specific codes)38.
Using the SEER-Medicare data from 2016 to 2019, we identified individuals aged 66 years or older with the ICD-O-3 diagnosis codes for the four cancer types in the SEER registry (see the Appendix H for specific codes)39. Among individuals with a cancer diagnosis recorded in the registry, eligibility required continuous enrollment in Medicare Parts A and B for the full calendar year (January 1 through December 31) during the year of the cancer diagnosis.
In both the PharMetrics Plus and SEER-Medicare populations, individuals who met the criteria for multiple cancer types within the same calendar year were classified based on the cancer type associated with the earliest healthcare claim (PharMetrics Plus) and earliest registry entry (SEER-Medicare). Consistent with a cross-sectional study design, all inclusion criteria were assessed independently for each calendar year. Individuals could contribute data to multiple years if they met the criteria separately in each respective year.
A diagnosis of metastatic cancer identified individuals with more severe disease. Specifically, we identified individuals with metastatic cancer based on diagnosis codes for metastases in claims data (PharMetrics Plus; at least one hospitalization or two outpatient visits), and the metastases information fields in the registry (SEER-Medicare) (see the Appendix H for specific codes).
Claims data: measures
We extracted data on Z codes using diagnosis code fields from PharMetrics Plus and Medicare claims data. All Z codes included in the main and sub-categories were used in the analysis (full Z codes were listed in Appendix I). The documentation of Z codes was identified at the individual-level, claim-level, and diagnosis-level.
For individual-level measurements, we calculated the annual frequency of individuals with at least one claim with Z codes and the corresponding rate among the study population as follows:
$$\:\frac{Number\:of\:individuals\:with\:Z\:codes\:in\:year\:t}{Total\:number\:of\:individuals\:in\:the\:study\:population\:in\:year\:t\:},\, where\,t = 2016, 2017 \ldots, 2020.$$
For claim-level measurements, we calculated the annual frequency of claims containing Z codes and the corresponding rate among all claims filed by the study population as follows:
$$\:\frac{Number\:of\:claims\:containing\:Z\:code\:in\:year\:t}{Total\:number\:of\:claims\:generated\:by\:the\:study\:population\:in\:year\:t}\, where\,t = 2016, 2017 \ldots, 2020.$$
We also examined the five top-ranked Z codes and calculated the proportion of the top-ranked Z codes among the claims with Z codes as follows:
$$\:\frac{Number\:of\:claims\:containing\:a\:specific\:Z\:code\:in\:year\:t}{Total\:number\:of\:Z\:code\:claims\:generated\:by\:the\:study\:population\:in\:year\:t} \, where\,t = 2016, 2017 \ldots, 2020.$$
For diagnosis-level measurements, we calculated the annual frequency of the three-digit Z code category and the corresponding rate among all diagnosis fields coded for the study population as follows:
$$\:\frac{Number\:of\:times\:a\:Z\:code\:category\:appeared\:in\:claims\:in\:year\:t\:}{Total\:number\:of\:times\:Z\:codes\:appeared\:in\:claims\:in\:year\:t}\, where\,t = 2016, 2017 \ldots, 2020.$$
Characteristics variables from claims data included gender, age, race and ethnicity, insurance payer type, geographic region and state, and comorbidities quantified using the Charlson Comorbidity Index (CCI)40,41. Information about gender, age, race, ethnicity, payer type (e.g., Medicare, Medicaid), geographic region and state were identified from the enrollment file. Individuals were associated with a specific comorbidity if at least one hospitalization or two outpatient visits with relevant diagnosis codes were recorded within the same calendar year. Area-level SDOH variables from PolicyMap were linked to the study population using geographic indicator variables (state-level indicators for the PharMetrics Plus data; both state and county indicators for the SEER-Medicare data). We categorized SDOH variables into three levels (low, medium, and high) using the tertiles of the area-level rankings for these variables.
Oncologist survey
Oncologists are a key stakeholder in the area of Z codes documentation. We developed a brief survey to gather their perspectives on our findings and provide additional context for our findings. The survey included three items (see Appendix J) aimed at assessing healthcare providers’ awareness, opinions, and potential future use of Z codes for documenting SDOH. The questionnaire was administered to oncologists/hematologists who participated in the OPEN and attended Summit meetings between October 2023 and November 2023. Each oncologist or hematologist was limited to participating in one Summit during a nine-month duration. This approach avoided duplicate data collection from the same individuals and ensured the inclusion of a broader range of physician perspectives. Each Summit recruited about 50 to 70 physicians.
Statistical analysis
Descriptive statistics were used to summarize individual- and area-level characteristic variables. We utilized a file with containing unique records (i.e., one row of data per person) to report summary statistics for the study population. For individuals who were included in multiple years during the study period, their characteristics were extracted from their first year of inclusion. Area-level PolicyMap measures were categorized into tertiles (high, medium, and low) based on the ranking for the measure across all states. For example, if a state ranked in the top tertile for out-of-pocket medical costs”, it was categorized as “high” for that measure. Chi-square and t-test were used to compare individual- and area-level characteristics between individual with and without Z codes. A p-value of
Descriptive statistics from the physician survey were presented as frequencies and percentages. All analyses were conducted using SAS Studio 3.71 that supports SAS version 9.4 (SAS Institute Inc., NC, USA).