All my LEDs and energy efficient appliances and we still went up by a lot?
How do you have a continuous 24/25 line when it’s only august? At best you can only have 2024 for Oct+, and average the first eight months.
And why does it start in april? Who starts a year-over-year comparison in april?
If the data is actually April24-Feb-25 – who needs March – then why is the 2019 data not labeled in the same way for the same april-feb cycle? No matter what, one of them is wrong.
And, you know, you’re missing an entire month. Kinda a big deal. March is important, just ask the romans.
This is a good thing. Electrification is our only true, scalable path to combating climate and maintaining/strenghtening livelihoods globally
would be cool to see what percentage of clean energy- hydro, solar, wind contributes to our current energy needs. our consumption may go up but if we have clean energy usage go up, to me it’s a win.
Now put temperature anomaly on it
In 2019, EVs were still a novelty. Today, I’m the only person on the block (admittedly small – six houses) that doesn’t have at least one EV. Amazon is driving all over town with them. My freaking uber to and from the airport were EVs.
Also, population growth is a thing.
Only sith deal in absolutes always do some sort of per capita
Weather plays a huge role in energy usage you can’t just pick random years and compare peaks.
10 comments
totally worth destroying the planet for AI waifus and hallucinated citations.
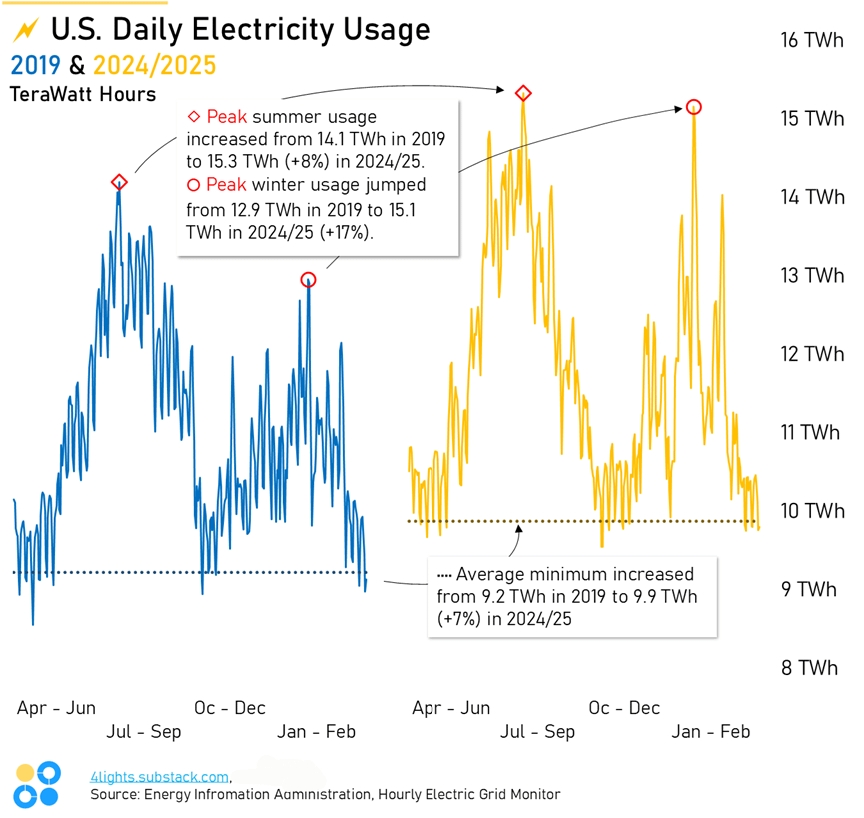
Source: Energy Information Administration, Electric Grid Monitor – https://www.eia.gov/electricity/gridmonitor/dashboard/electric_overview/US48/US48
Viz created in Excel
Read more on the substack: https://4lights.substack.com/p/electricity-usage-new-daily-record
All my LEDs and energy efficient appliances and we still went up by a lot?
How do you have a continuous 24/25 line when it’s only august? At best you can only have 2024 for Oct+, and average the first eight months.
And why does it start in april? Who starts a year-over-year comparison in april?
If the data is actually April24-Feb-25 – who needs March – then why is the 2019 data not labeled in the same way for the same april-feb cycle? No matter what, one of them is wrong.
And, you know, you’re missing an entire month. Kinda a big deal. March is important, just ask the romans.
This is a good thing. Electrification is our only true, scalable path to combating climate and maintaining/strenghtening livelihoods globally
would be cool to see what percentage of clean energy- hydro, solar, wind contributes to our current energy needs. our consumption may go up but if we have clean energy usage go up, to me it’s a win.
Now put temperature anomaly on it
In 2019, EVs were still a novelty. Today, I’m the only person on the block (admittedly small – six houses) that doesn’t have at least one EV. Amazon is driving all over town with them. My freaking uber to and from the airport were EVs.
Also, population growth is a thing.
Only sith deal in absolutes always do some sort of per capita
Weather plays a huge role in energy usage you can’t just pick random years and compare peaks.
Comments are closed.