Notes:
Sources: OECD Affordable Housing Database (2023), World Bank Urbanization Reviews
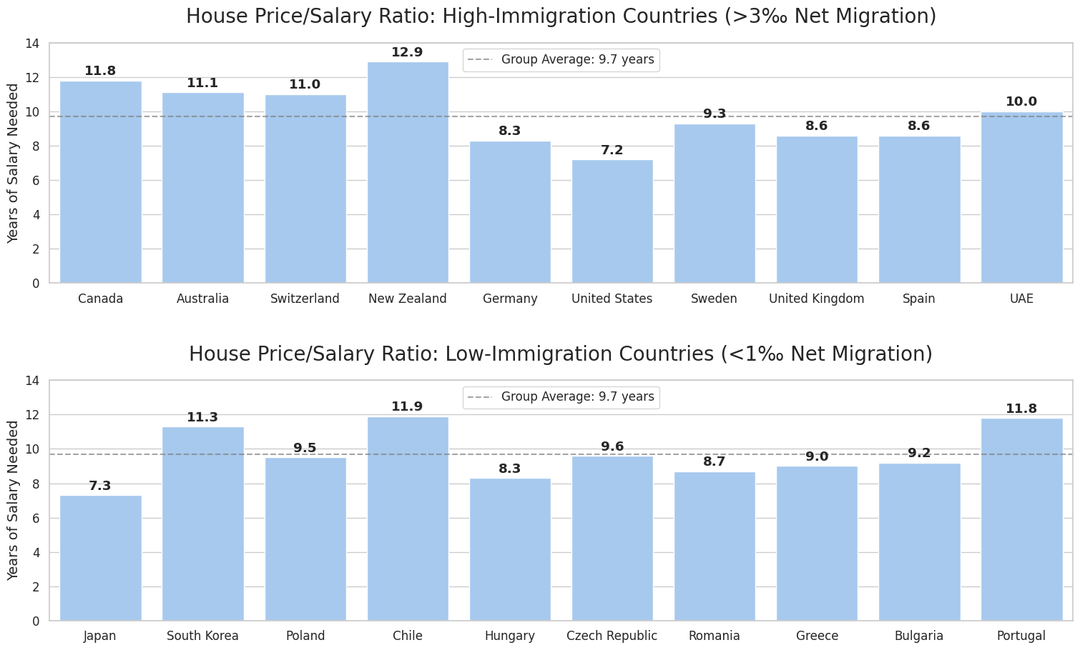
All countries included are >0.850 HDI (Very High)
Countries with 1‰ and 3‰ migration rates are not included.
Posted by Rauram99
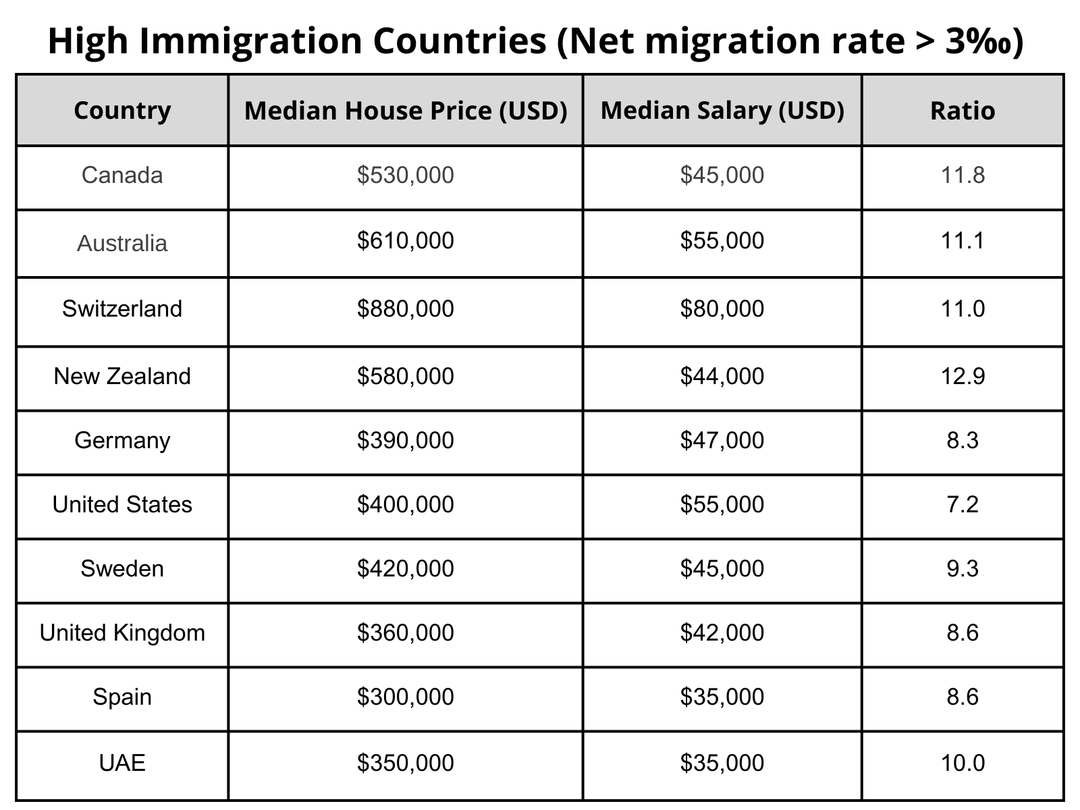
Notes:
Sources: OECD Affordable Housing Database (2023), World Bank Urbanization Reviews
All countries included are >0.850 HDI (Very High)
Countries with 1‰ and 3‰ migration rates are not included.
Posted by Rauram99
15 comments
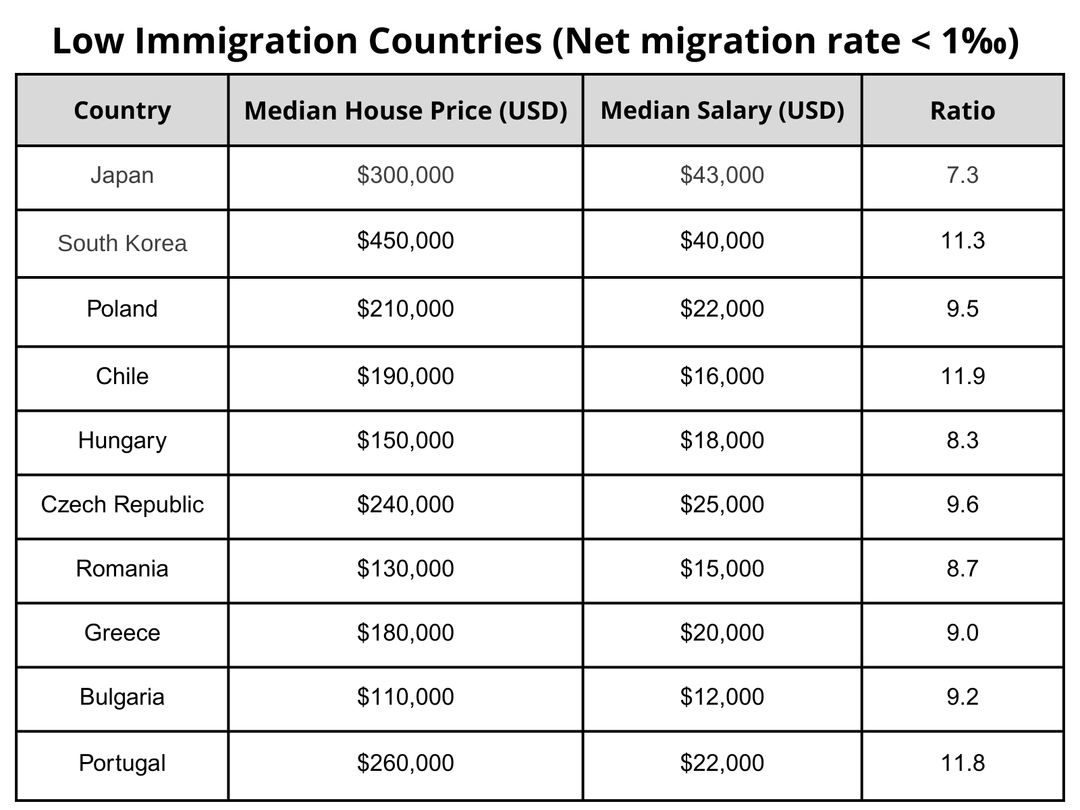
Done with Python, using Matplotlib and Seaborn libraries: [https://colab.research.google.com/drive/1BJBLsu40dutRo8IbAspSL8D-OiiKNrYn](https://colab.research.google.com/drive/1BJBLsu40dutRo8IbAspSL8D-OiiKNrYn)
Portugal isn’t low, I guess expats aren’t counted
But why should a single median salary be enough to buy a home
It’s just unrealistic
The data would be better suited for a scatterplot with continuous net migration rate. Unless we are not anticipating a dose response for some reason.
This is making it seem like immigration is a major factor in housing affordability when there’s so so much more to the picture. We should look at zoning leniency and housing costs, or single family homes per 100,000 housing units and housing costs.
Immigrants are usual a net benefit to society, but it’s important that society builds enough housing and capacity to support new citizens. The west has historically not done this
Interesting that there happen to be the exact same number of countries in both groups.
Or is this data cherry picked?
I do not see this appropriately presented. While it might show some direction I think the income should be presented after taxes. The median income is lower in all of the countries after taxes which makes the ratio higher and closer to reality. Also factor in cost of living. This will actually show that with how much is earned after taxes and subtract how much is needed to live in a country – will give a Median of how much can actually be spent on a new real estate acquisition. Then the real ratio will show us that a median earning person would actually need more than 30 years – if not more to afford anything.
So the US, with high immigration, has lower housing costs than countries with low immigration/ Interesting.
If anything, the distribution on both charts suggests to me that immigration has no effect on housing costs at all.
If we used “net population growth” rather than just immigration, would the numbers be significantly different?
Genuinely curious. I know there’s always going to be some outliers too, especially for smaller, more densely populated nations with actual space constraints.
This data seems…wrong? 1 in 10 people in Portugal are immigrants how is it a low immigration country
The correlation you are looking for is between rental homes vs owned homes. When homes can be rented out they become businesses and instruments of speculation, it also prevents people from building wealth. Only by restricting rentals through high taxes or regulations can home prices come down. There is no reason for home prices to go up because the population is stagnate or shrinking in almost all of these nations.
If you tried and advocate higher migration isn’t related to higher housing prices, i have bad news for ya
Lol love how people are shitting on you cause the real data doesn’t support their biases.
The idea that immigration causes increased house prices has long been been false, generally.
I think the graphs are very pretty and easy to understand, good job.
In NZ there is zero tax on house sale profits also so that helps drive up prices. People are making half a million dollars of pure profit and the govt just says “that’s cool”
Meanwhile they will tax people earning min wage at like 20%
Comments are closed.