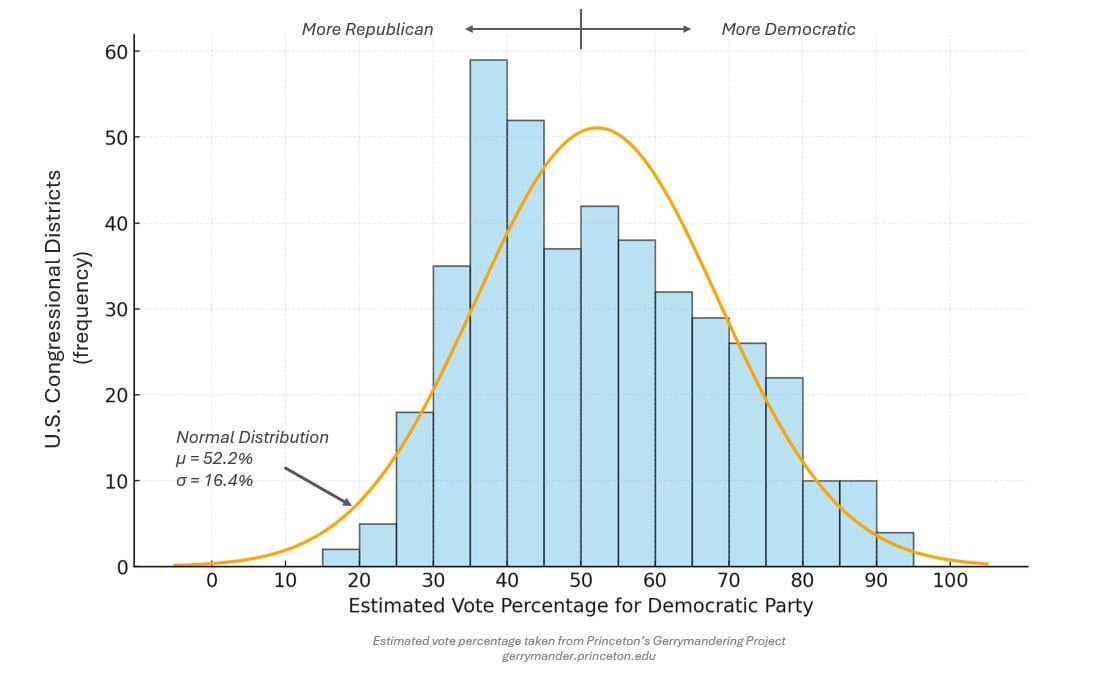
Data taken from Princeton’s Gerrymandering Project (https://gerrymander.princeton.edu). Data not available for eight states (AK, DE, HI, ND, SD, VT, WV, WY). Created using GPT-5.
I wonder if a normal distribution is what would be expected with nonpartisan districting. I suspect it’d be more likely to be bimodal, with rural districts and urban districts having distinct peaks
This graph doesn’t show any indication of gerrymandering though. I just shows that there are more republican-leaning districts. That can also be explained simply by “that much more people voted republican than democrat.”
And others have already said: The assumption of normal distribution as a comparison is questionable.
Wait can you explain this graph? How is it showing gerrymandering, instead of showing a skew towards a higher portion of The district voting for Republicans?
Cool graphic! It would be nice to see how this aligns with packing vs. cracking. For example, is a district in which democrats win 35% of the vote considered cracked in favor of republicans, or packed in favor of democrats?
The answer is probably contextual for each state, so it might be hard to visualize in a graph like this.
Republicans don’t care about facts
I heard a story on NPR today where the expert said “Democrats have already reached they maximum potential to gerrymander outside California” because of states like New Mexico, Connecticut, and four or five others he listed.
there are lots of blue states that have indy restricting commissions. Are those states going to gerrymander?
It’s a wonderful graph, but your point is better made by the inverse: estimated vote percentage for Republican Party. The existence of lots of districts that have just over 50% republican at the expense of the left and right side of the distribution is easy to see as republican gerrymandering.
Why does this graph assume a normal distribution of vote share across all districts? I don’t see any reason to assume that’s true. Look at Maryland, where democrats won every seat.
Moreover, why does this normal distribution believe that the democratic party should have an inbuilt vote advantage in the house? It seems to be centered around 50-55. But Republicans got more total votes for the house in the last election and democrats routinely get less than 50%.
In 2024 democrats got 47.2%.
If you slide the curve one ‘bar’ to the left to be where you’d expect it to be going off of national averages it would look very different.
That said, I don’t see any reason to suppose a normal distribution is appropriate here. The cities are heavily democratic, which means anything that is built on compactness is going to lead to more very heavily democratic districts, and more ‘just barely republican’ districts if we factor in that republicans have slightly more votes in the house overall.
Republicans would rather give up democracy than give up their Conservative ideology.
There are a few things to understand about gerrymandering.
The first is that both sides do it, and have done it for 200+ years. In fact, the term is older than both the Democratic and the Republican parties. Everyone complains when the other side does it, and doesn’t notice when their side does it.
The second, and the big problem, is that no one can define exactly how districts should be set up anyway. How do we decide where the lines should be drawn? There is no logical, objective way of doing it, and whatever criteria you decide to favor will often end up favoring one party or the other.
Let’s say you have a big catholic neighborhood, and they’re all one district, and they all tend to vote the same way. The people there are probably happy about this. But should we deliberately go about creating such districts? If so, do we divide by party, or by religion, or by race, or by urban vs rural, or what? What if that big catholic area has always been divided into 2 districts, with other neighborhoods thrown in? If we deliberately redraw the lines to make them their own district, is that gerrymandering?
What if there are 3 majority black areas, and they are geographically separated enough that they’ve always been in 3 districts. Is it ok to draw a weirdly shaped district to combine them into 1 district? Because doing so might end up with 1 extra district for the democrats, if they vote democrat. Or maybe it might end with with less districts for the democrats, because the 3 areas used to vote democrat but now you’ve shoved all the democrats into 1 district and the other 2 are now majority republican?
So the problem is that wherever you draw the lines and whatever rules you use to draw them will end up benefiting one party and hurting the other. And both sides do this all the time when they get the ability to draw districts. And then people decide we should do it objectively, but no one knows how anyway.
How does this graph show gerrymandering?
What I’d like to see is a scatter plot with percent D vote statewide vs percent D seats in the Federal and State houses, and maybe color code by average income.
Well duh
Everyone knows that dems are the masters of gerrymandering. Half a dozen states that are 30-40%Republican with zero red seats
Quite. Few more like CA that are 40% red and 80%+ blue seats
14 comments
Data taken from Princeton’s Gerrymandering Project (https://gerrymander.princeton.edu). Data not available for eight states (AK, DE, HI, ND, SD, VT, WV, WY). Created using GPT-5.
I wonder if a normal distribution is what would be expected with nonpartisan districting. I suspect it’d be more likely to be bimodal, with rural districts and urban districts having distinct peaks
This graph doesn’t show any indication of gerrymandering though. I just shows that there are more republican-leaning districts. That can also be explained simply by “that much more people voted republican than democrat.”
And others have already said: The assumption of normal distribution as a comparison is questionable.
Wait can you explain this graph? How is it showing gerrymandering, instead of showing a skew towards a higher portion of The district voting for Republicans?
Cool graphic! It would be nice to see how this aligns with packing vs. cracking. For example, is a district in which democrats win 35% of the vote considered cracked in favor of republicans, or packed in favor of democrats?
The answer is probably contextual for each state, so it might be hard to visualize in a graph like this.
Republicans don’t care about facts
I heard a story on NPR today where the expert said “Democrats have already reached they maximum potential to gerrymander outside California” because of states like New Mexico, Connecticut, and four or five others he listed.
there are lots of blue states that have indy restricting commissions. Are those states going to gerrymander?
It’s a wonderful graph, but your point is better made by the inverse: estimated vote percentage for Republican Party. The existence of lots of districts that have just over 50% republican at the expense of the left and right side of the distribution is easy to see as republican gerrymandering.
Why does this graph assume a normal distribution of vote share across all districts? I don’t see any reason to assume that’s true. Look at Maryland, where democrats won every seat.
Moreover, why does this normal distribution believe that the democratic party should have an inbuilt vote advantage in the house? It seems to be centered around 50-55. But Republicans got more total votes for the house in the last election and democrats routinely get less than 50%.
In 2024 democrats got 47.2%.
If you slide the curve one ‘bar’ to the left to be where you’d expect it to be going off of national averages it would look very different.
That said, I don’t see any reason to suppose a normal distribution is appropriate here. The cities are heavily democratic, which means anything that is built on compactness is going to lead to more very heavily democratic districts, and more ‘just barely republican’ districts if we factor in that republicans have slightly more votes in the house overall.
Republicans would rather give up democracy than give up their Conservative ideology.
There are a few things to understand about gerrymandering.
The first is that both sides do it, and have done it for 200+ years. In fact, the term is older than both the Democratic and the Republican parties. Everyone complains when the other side does it, and doesn’t notice when their side does it.
The second, and the big problem, is that no one can define exactly how districts should be set up anyway. How do we decide where the lines should be drawn? There is no logical, objective way of doing it, and whatever criteria you decide to favor will often end up favoring one party or the other.
Let’s say you have a big catholic neighborhood, and they’re all one district, and they all tend to vote the same way. The people there are probably happy about this. But should we deliberately go about creating such districts? If so, do we divide by party, or by religion, or by race, or by urban vs rural, or what? What if that big catholic area has always been divided into 2 districts, with other neighborhoods thrown in? If we deliberately redraw the lines to make them their own district, is that gerrymandering?
What if there are 3 majority black areas, and they are geographically separated enough that they’ve always been in 3 districts. Is it ok to draw a weirdly shaped district to combine them into 1 district? Because doing so might end up with 1 extra district for the democrats, if they vote democrat. Or maybe it might end with with less districts for the democrats, because the 3 areas used to vote democrat but now you’ve shoved all the democrats into 1 district and the other 2 are now majority republican?
So the problem is that wherever you draw the lines and whatever rules you use to draw them will end up benefiting one party and hurting the other. And both sides do this all the time when they get the ability to draw districts. And then people decide we should do it objectively, but no one knows how anyway.
How does this graph show gerrymandering?
What I’d like to see is a scatter plot with percent D vote statewide vs percent D seats in the Federal and State houses, and maybe color code by average income.
Well duh
Everyone knows that dems are the masters of gerrymandering. Half a dozen states that are 30-40%Republican with zero red seats
Quite. Few more like CA that are 40% red and 80%+ blue seats
Comments are closed.