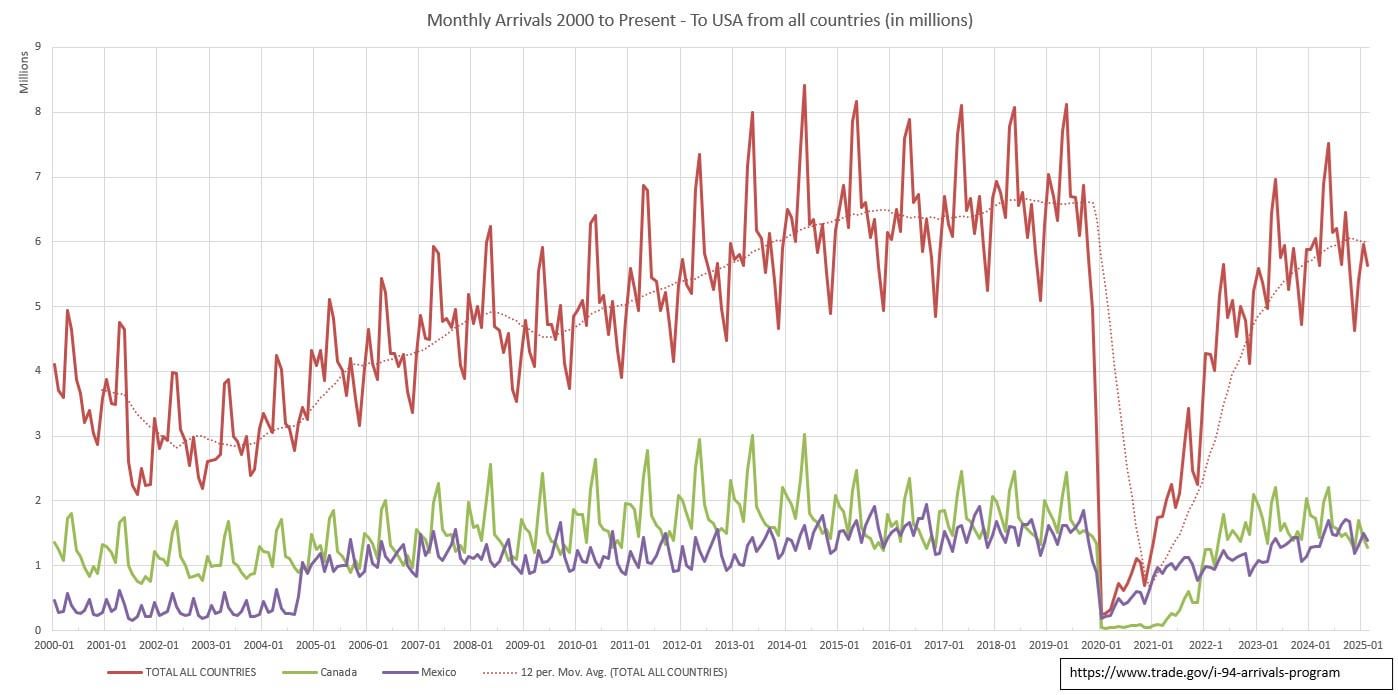
So someone posted about travel flying data in the US for 3 years (2023-2025) and that post's OP and other commenters were trying to understand if we are getting less visitors. That original post seemed to show that some places were affected but overall inconclusive. https://www.reddit.com/r/dataisbeautiful/comments/1mw11pe/oc_nonus_citizens_flying_to_the_us_from_2023mid/ There was a request if more data was available.
The data above is all visitors to USA (land and sea) based on country of residence, data from https://www.trade.gov/i-94-arrivals-program and graphed via excel. With this longer timeline, I believe this trend is showing a decline or slowdown in foreign visitors. Shown in the graph the effect of the pandemic on travel and the recovery. Added in the graph is a 12 month moving average trendline.
The current messaging from the administration is definitely not a welcoming vibe for travelers. Together with increasing prices, problems at Customs/Immigration and political uncertainty globally, it can definitely put a chilling effect on travel.
Visitors from Mexico is +13.9% year over year, from Canada is -16.8% and from overseas is -0.8%. (This statistic is from the linked page). One might ask, its such a small change from last year, why are people making a big fuss? Well, businesses expect year over year increases in profits to keep up with inflation.
Let's combine this with the income information below.
Data from https://www.trade.gov/survey-international-air-travelers-siat shows that:
The median annual household income of air travelers from Mexico in 2024 is $35.9k ($68.5k mean).
The median annual household income of air travelers from Canada in 2024 is $105.4k ($127.1k mean).
The median annual household income of land travelers from Mexico in 2024 is $21.3k ($46.9k mean).
The median annual household income of land travelers from Canada in 2024 is $78.5k ($91.8k mean).
The median annual household income of travelers from overseas in 2024 is $63.1k ($88.3k mean).
What we can infer from the household income from above is that Canadian travelers have more spending power when they are travelling to the USA compared to Mexican travelers. So while we have an increase in travel from Mexico, the decrease in Canadian travelers have a larger economic impact. There is a lot of good data published from trade.gov and someone can run a deeper analysis in the future on which states may be more impacted based on visitor data.
I've heard of reporting from Florida where their tourism heavily relies on Canadian travel during the winter months are expecting a rough time next season. This last season, it was likely too late for many to cancel plans. I have personal experience of friends and family refusing or delaying travel from Canada because of the current political climate.
Posted by orangeswim
8 comments
The data above is all visitors to USA (land and sea) based on country of residence, data from [https://www.trade.gov/i-94-arrivals-program](https://www.trade.gov/i-94-arrivals-program) and graphed via excel. Additional information in post from [https://www.trade.gov/survey-international-air-travelers-siat](https://www.trade.gov/survey-international-air-travelers-siat)
Direct source: [https://www.trade.gov//sites/default/files/2024-06/Monthly%20Arrivals%202000%20to%20Present%20%E2%80%93%20Country%20of%20Residence%20%28COR%29_1.xlsx](https://www.trade.gov//sites/default/files/2024-06/Monthly%20Arrivals%202000%20to%20Present%20%E2%80%93%20Country%20of%20Residence%20%28COR%29_1.xlsx)
Nice. Thank you for being explicit about which country this refers to (sometimes people forget).
I’m interested that during the pandemic the data shows a masive drop in Dec 2019/ Jan 2020. Does that mean there is something strange going on with the times reported in the underlying data by trade.gov? I would have expected that drop 4-5 months later.
This is about to fall off a cliff
This just goes to February 2025. The graph only has one datapoint after the start of 2025. May would be almost half the year. The most interesting part is missing!
Out of interest, when are figures for June and July expected?
What happend 2005 with Mexicans?
Very interesting graph. Why did arrivals from Mexico jump in mid 2004?
Wait are you attributing a policy shift to explain the entirety of the post-COVID shift when you only have two months of data after the policy shift? Lol.
Dang, what happened in 2020??
Comments are closed.