September natural gas futures sank to a new nine-month low on Friday as unseasonably cool weather crushed demand outlooks, overwhelming Thursday’s bullish storage report and a late week rebound in LNG exports.

Chart showing NGI’s National Average Daily Natural Gas Price and Lower 48 Natural Gas Power Burn for 2024 and 2025. The left y-axis tracks natural gas prices in $/MMBtu, peaking near $18 in January 2024 and trending mostly between $2 and $6 afterward. The right y-axis tracks power burn in Bcf/d, with 2025 levels significantly higher than 2024, peaking above 55 Bcf/d in late July 2025. The chart highlights August 22, 2025, with a red marker. Data sourced from NGI’s Daily Gas Price Index and Wood Mackenzie.

Expand

At A Glance:

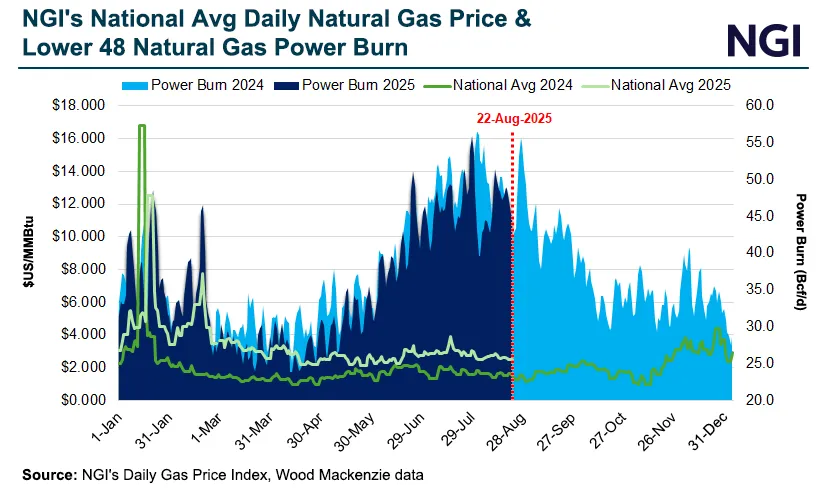
August trending coolest in 25 yearsLNG rebounds 1.8 Bcf/d in two daysProduction above 107 Bcf/d