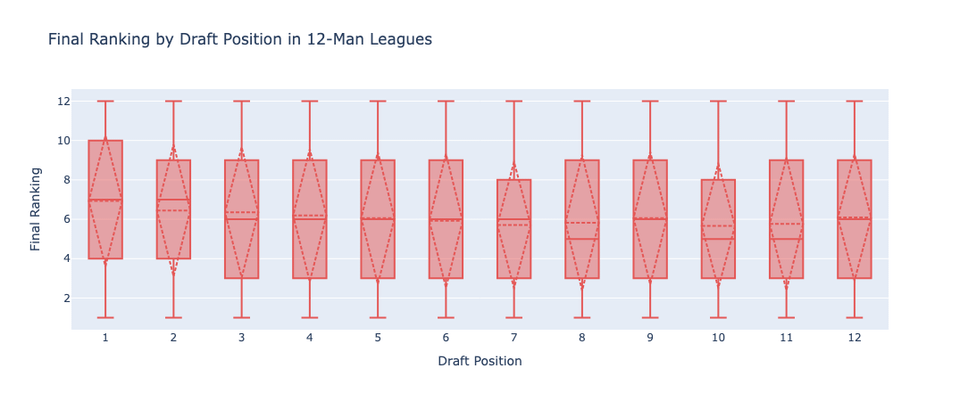
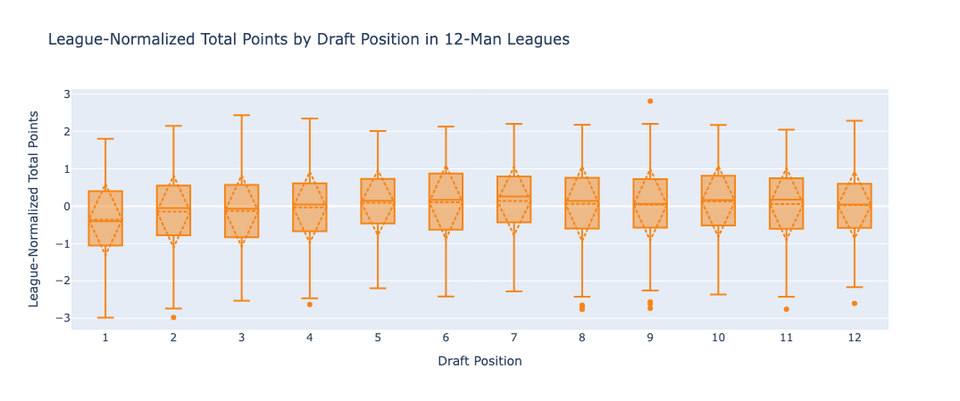
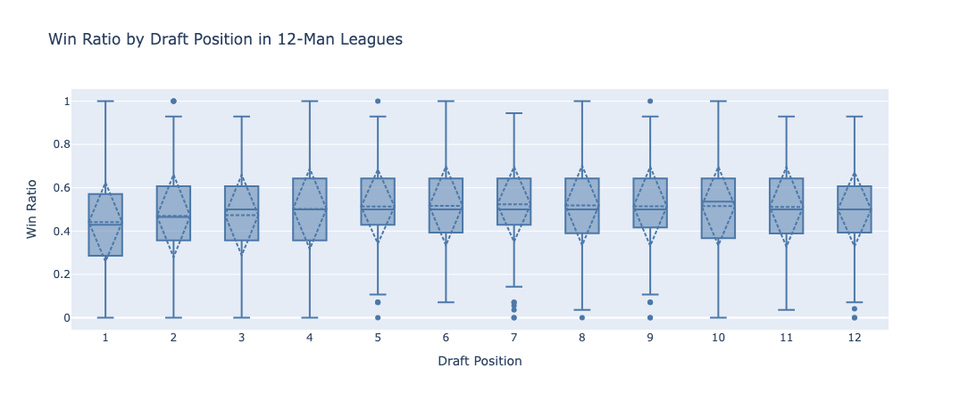
To assess how draft position affected league performance, I looked into over 400 12-man leagues (all snake drafts) and plotted win ratio, normalized points earned (normalized within a given league to account for various scoring and roster settings), and final league ranking for each draft position.
Surprisingly, 1st pick performed worst on average across all metrics.
League data collected from Sleeper API.
Posted by rsrgrimm
6 comments
I plan on diving into this data more, so let me know if you have any suggestions for further analysis
It appears nothing happened whatsoever. Did you run any statistical tests such as turkey HSD, ANOVA, or something more specific for rank ordering to test this rigorously.
> Surprisingly, 1st pick performed worst on average across all metrics.
not really surprising when the consensus number 1 pick ended up only playing 4 games and finishing as RB73
What do the triangles mean and what are the dots outside the whiskers mean?
Personally I’d reverse the Y-axis so winning teams are higher than losing teams.
Better players tend to draft last….
Comments are closed.