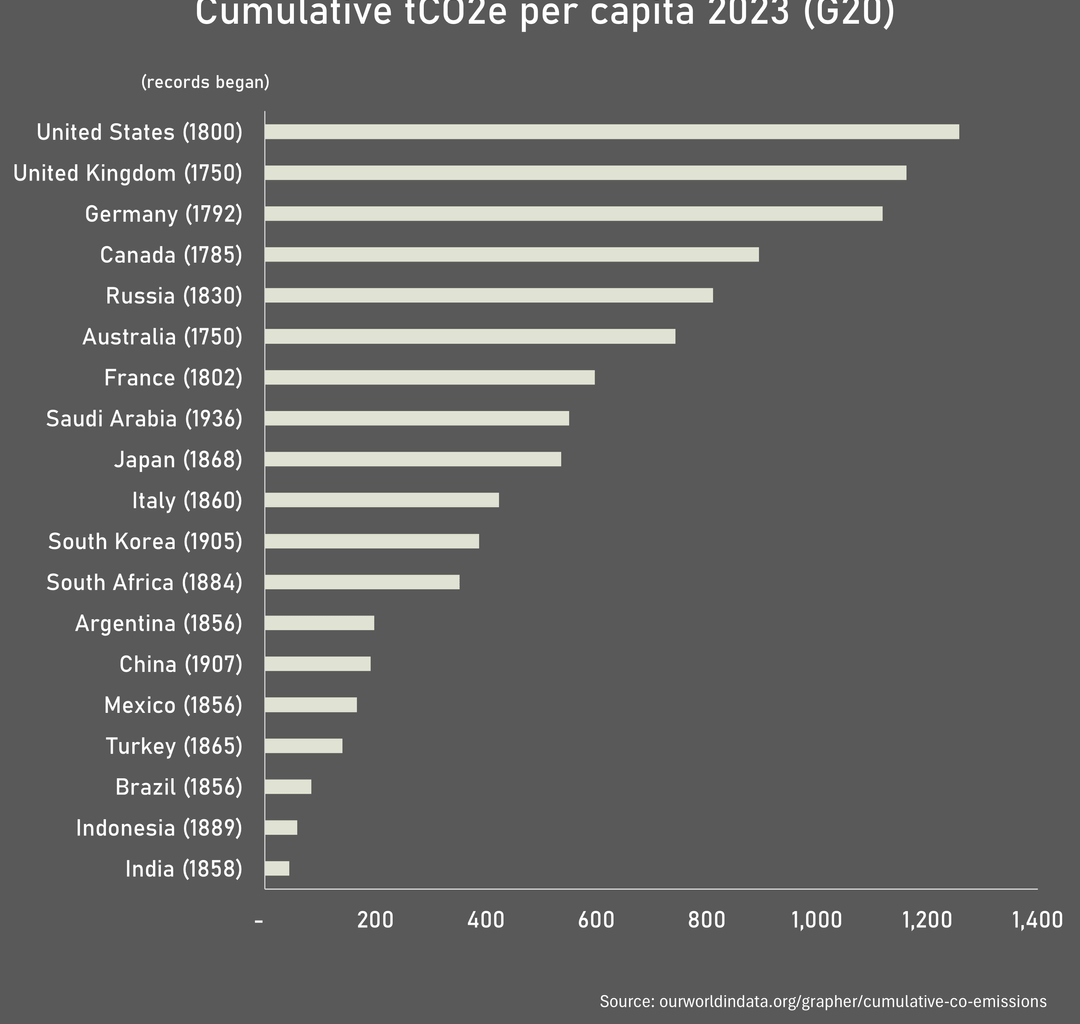
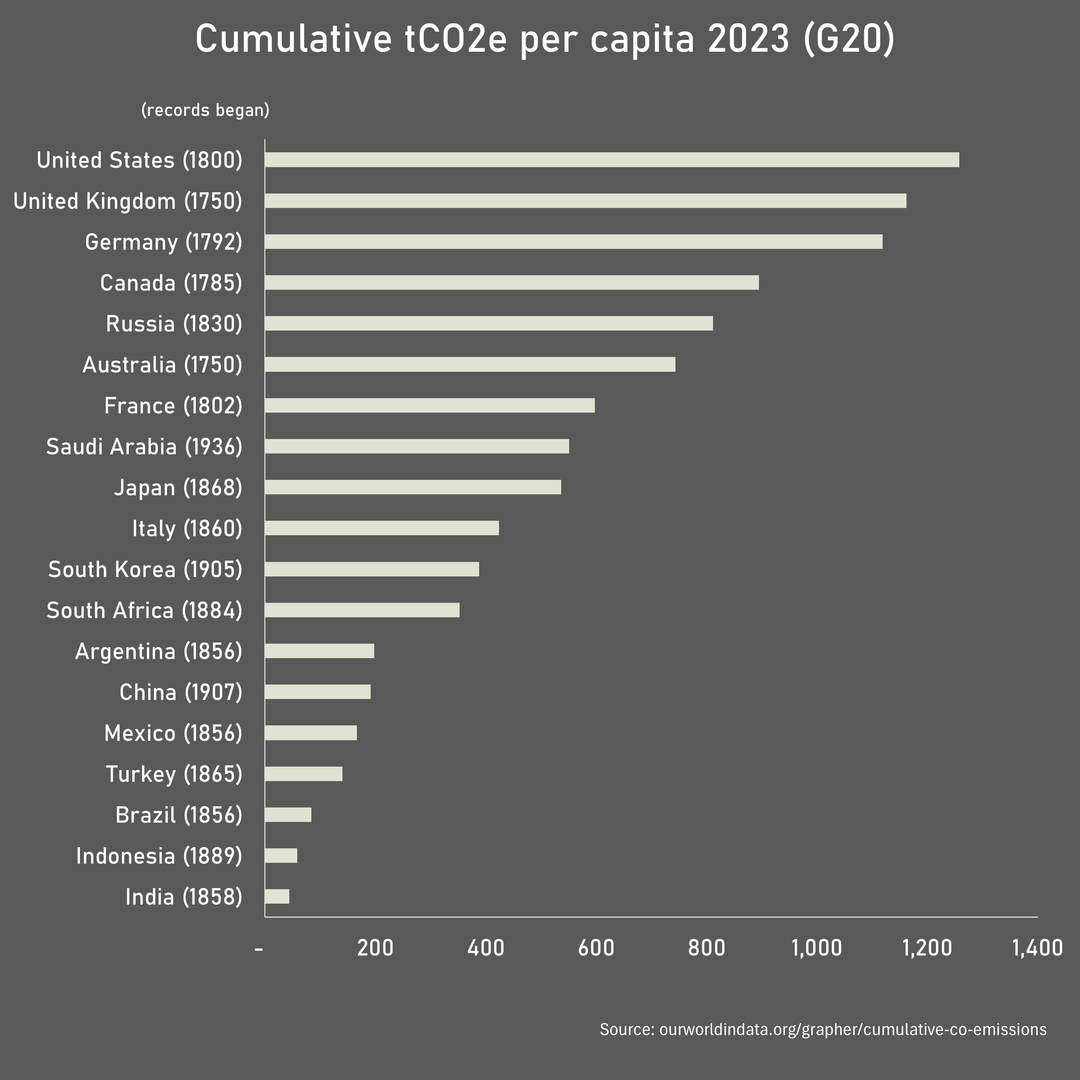
The first chart shows which G20 countries are most responsible for historic CO2e emissions compared to their current population.
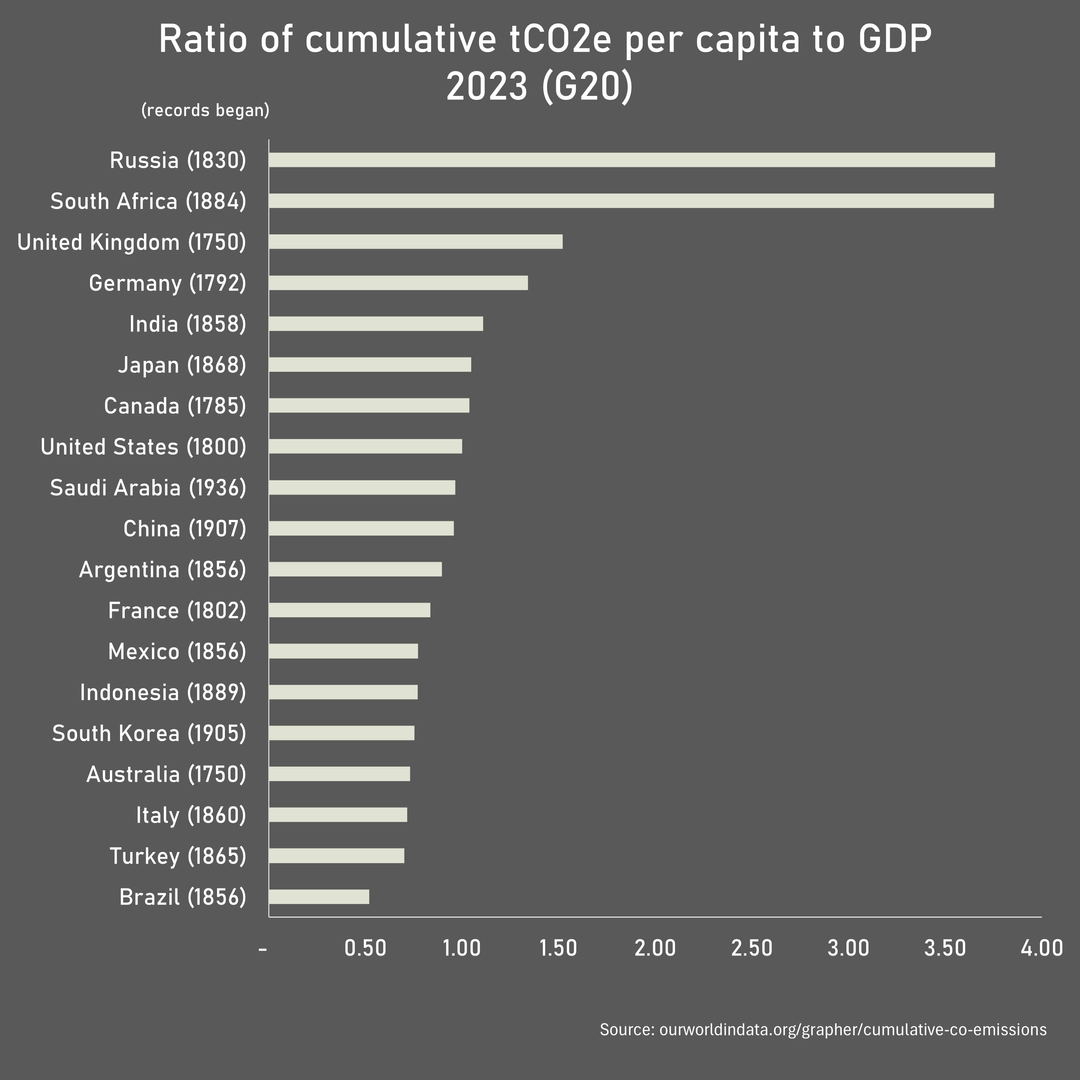
The second shows the efficiency with which countries have developed. eg
USA = 1:1
The UK compared to the USA has emitted 92% emissions per person and has a GDP/capita 61% that of the USA. So it has an efficiency of 1.52 as it has not achieved the same level of wealth for the same amount of emissions.
Posted by PrettyGazelle
9 comments
These are great but I think they could benefit from a narrative title in the graphics themselves to describe what they show. The current titles would be better as subtitles.
Why is brazil higher than india despite being a lower number on the 1st image?
Really hammers home the point in how inefficient Soviet Industry was.
INB4 the dipshits find this and start saying “but what about China?!”
Edit: to elaborate.
TL;DR: **If you are a US consumer and of US voting age, you as an individual have more power *AND* more responsibility to mitigate climate change through your consumption choices and your voting choices than the average Chinese citizen does.** We must be better and worry about cleaning up our own house before we look abroad and say “y’all need to clean up your houses.”
Yes, in current, absolute terms, China undoubtedly emits far more GHGs than any other country. However, the reason the China whataboutists piss me off is that this uncontextualized fact is used by bad actors in the US as an excuse to throw our collective arms up and not do our part to mitigate climate change. This is bullshit for several reasons that are obvious to anyone who is acting in good faith and has critical thinking skills.
1) [Per capita emissions](https://ourworldindata.org/grapher/per-capita-ghg-emissions): As China is the second most populous country, of course its emissions are going to be high. To identify which countries are emitting more than their fair share per year and to what extent, compare share of emissions and share of population:
-China: 26% of GHG emissions vs 17% of world population (it is emitting 1.5x more than its fair share of emissions)
-US: 11% of GHG emissions vs 4% of world population (it is emitting 2.75x more than its fair share of emissions)
2) [Cumulative emissions](https://ourworldindata.org/grapher/cumulative-co-emissions): Emissions don’t reset at the end of every year. The surplus emissions above what is naturally cycled in the world accumulate and accumulate. The PPM of GHG emissions in the world has been going up rapidly for about 200 years. **The US is responsible for 24% of these emissions, the EU is responsible for 16.5%, and China is responsible for 15%.**
So basically, when the chuds here in the US say China needs to do more while we do jack shit, it is akin to making someone else clean up the mess that you did more to cause. It is hypocritical and unethical. True—China needs to act just as we need to act. However [the US is slowing down climate change mitigation](https://www.eia.gov/outlooks/steo/report/total.php) while [China is speeding up.](https://www.bloomberg.com/news/articles/2025-06-19/have-china-s-carbon-emissions-finally-peaked?sref=Oz9Q3OZU&embedded-checkout=true)
So for emissions you look at the entire history, but for population you’re only considering the present?
If you want a number that makes sense you need to divide by how many people have lived cumulatively in each of those countries
Sorry but i don’t believe that the metric historic cumulative emissions/current population is particularly relevant. This implies that for instance second generation british pakistaneese should feel responsible for the coal furnaces of the 1820s owned by wealthy english capitalists.
Even more, if the goal is trying to draw responsabilities and guilt on the basis on past emissions, then I believe that anything predating 1975 should be discarded, as there was no systematic scientific realization of the issue.
As for the second graph, it quite don’t see the point. We know that south africa has been one of the most coal dependant nations on earth with a sizable economy, while USSR/Russia have been ecological disasters on an epic scale, all the while having an extraordinary efficient economy.
What’s as big as a house, burns 20 liters of fuel every hour, puts out a shit‑load of smoke and noise, and cuts an apple into three pieces? A Soviet machine made to cut apples into four pieces!
You are doing good work OP.
Your process is clear and you are showing valuable results.
Dont let these idiots bother you just because your methodology does not result in the list they want to see.
They crave confirmation, not learning.
Just out of curiosity. How did they measure the CO2 in the 17 and 18 hundreds? Was the measurement method standardized across all these nations?
Comments are closed.