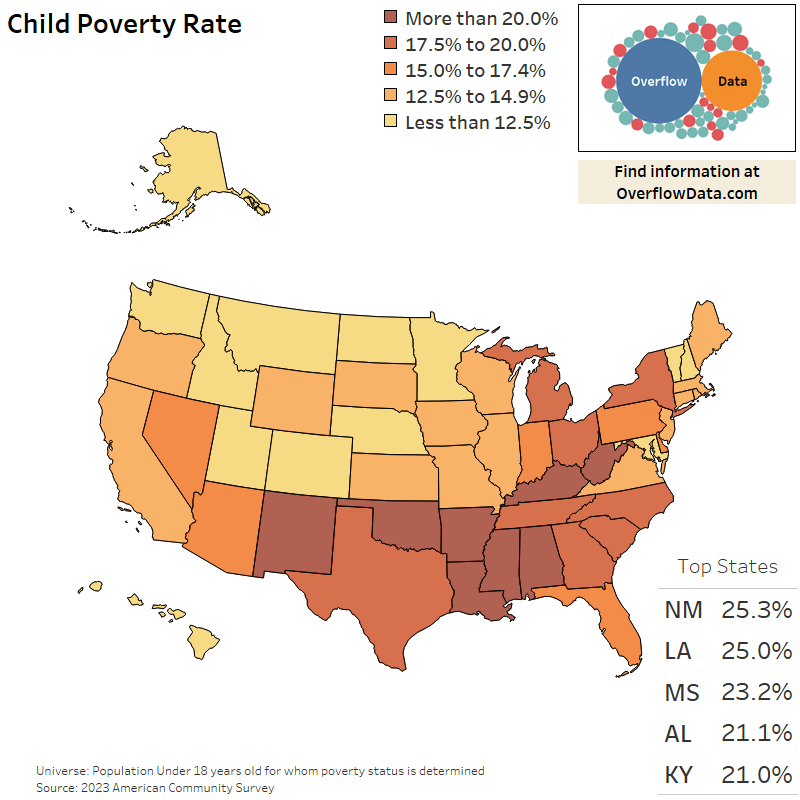
This map shows child poverty rates by state from the 2023 American Community Survey (ACS) 1-year estimates. Rates are calculated for children under 18 for whom poverty status can be determined.
Some highlights:
- New Mexico (25.3%) and Louisiana (25.0%) have the highest child poverty rates in the country.
- There are many states in the Northeast, Northwest, and Mountain west that are below 12.5%.
I built this visualization in Tableau. You can explore more data here:
This map pairs with my work on the Quality Wellness Indicator for Children (QWIC) that I published earlier this week. This goes beyond poverty to measure whether kids have the protective factors (family stability, education, health coverage, etc.) that give them the chance to thrive.
Posted by OverflowDs
7 comments
Created with Tableau and the 2023 ACS 1-year estimates.
What is the methodology for determining “poverty” here?
hmmm why are republicans universally supporting policies that would create lots of poor, uneducated, hand-to-mouth, ideological, radical people that will die as soon as they’re not able to work???
It can’t have anything to do with creating the sort of society that benefits exclusively the type of person who already has a lot of money and power, right? Like a feudal society or chattle slave society? RIGHT??
Louisiana doesn’t surprise me at all, but New Mexico does. Is this a function of NM having a lot of native Americans living in poverty on reservations, or is it something else?
LetŌĆÖs go Deep South red states!!!
Oh look at the big beautiful brown belt. Let me make a prediction, 4 years from now the map will look exactly the same. Vote Republican, eat shit.
Keep in mind that poverty is anything less than $31,200 for a family of 4. $2,600/month. Pretty pathetic
Comments are closed.