
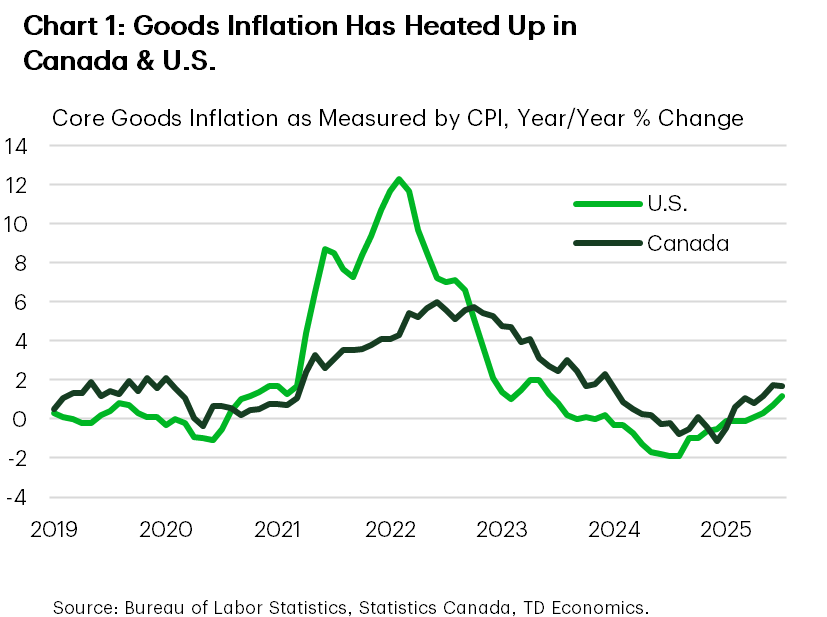
The impact of tariffs on U.S. inflation has been smaller than most economists had expected so far. We would expect tariffs to show up in the prices of goods that are imported from tariffed countries or have a high degree of imported inputs. Through the three-months ending in July, core goods prices are up 1.5% annualized and have accounted for only a tenth of the increase in core inflation. This is a modest uptick from last year when goods prices were flat, and a far cry from their peak post-pandemic when they reached +12% year/year and accounted for nearly half the rise in core inflation (Chart 1). This has led some media pundits and members of the Trump administration to suggest that economistsÔÇÖ warnings on inflation were overblown.┬á
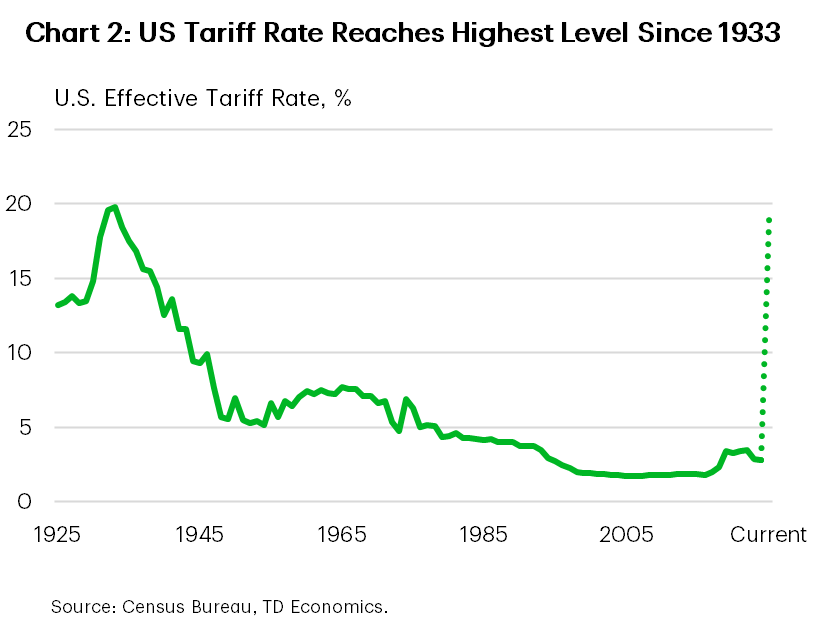
But we argue that itÔÇÖs still early innings in a very long game. Trump had promised tariffs in his campaign, and tariff policies came with all sorts of pauses, exemptions and carve-outs, giving companies an opportunity to stockpile inventories to limit tariff exposure through the first several months. Other factors, including a geographic shift in where companies are sourcing goods, have also helped to mitigate the push on goods inflation. But with the administration increasing tariffs by 10-41% on over 60 countries as of August 7th, and further Section 232 sectoral tariffs in the pipeline, subdued readings on goods prices are likely nearing the end of their runway. We estimate that the effective tariff rate in the U.S. is around 19%, or the highest level since 1933 (Chart 2). At this level, the annual tax revenue from tariffs ÔÇô assuming no material shifts in the import base ÔÇô is around $400 billion per-year. ItÔÇÖs unrealistic to assume that corporations can absorb that entire cost. And while there was some hope that exporters would cut prices in effort to reduce the impact of tariffs for their U.S. customers, import deflators have shown no evidence of this so far. This is further borne out by consumer prices for June and July, which have shown evidence of some tariffs passing through to prices on products that are predominantly imported. We anticipate that cost pressures will both broaden and intensify over the next year.┬á┬á
ItÔÇÖs been a different story in Canada. Bucketing the inflation data into ÔÇÿtariffÔÇÖ and ÔÇÿnon-tariffÔÇÖ categories shows near immediate price responses following the implementation of CanadaÔÇÖs retaliatory measures. Between March and June, we estimate that the ÔÇÿtariffÔÇÖ related categories accounted for one-quarter of the monthly gains in inflation. Encouragingly, those effects showed signs of petering out in July. While one data point doesnÔÇÖt make a trend, we are reasonably confident that the impact on inflation in Canada will be less severe than in the U.S. CanadaÔÇÖs retaliatory measures have since been removed on CAD$44 billion┬á of products (~11-12% of imports), and previously only applied to less than 14% of total imports. In comparison, the U.S. tariffs touch nearly all goods imported from every trading partner. Ultimately, itÔÇÖs the size, scope and breadth of the U.S. tariffs that will generate the disproportionate push on goods inflation.┬á
But all forecasts contain two-sided risks. There are two wildcards to play. One is the potential for larger supply chain disruptions. The second is whether (or how) global corporations try to minimize price increases in the U.S. by passing higher costs onto all global customers. This is a particular concern in Canada where many firms have high supply-chain integration with U.S based firms. 
Tariff Whiplash Has Limited Impact on Inflation 
Following U.S. trade developments can lead to tariff whiplash. What started as tariffs imposed on Canada, Mexico and China to address cross-border movement of fentanyl and illegal immigration quickly escalated into a full-blown protectionist shift in U.S. trade policy on April 2nd. Liberation Day brought significantly higher tariffs for all trading partners, though it was incredibly short-lived. By April 9th, the administration announced a 90-day delay to allow countries time to negotiate new trade agreements. 
China was the one exception. Its tariff rate was raised from 40% to 100% and then to 145% for its retaliation to both the reciprocal and fentanyl tariffs. But that too was short-lived, as constructive negotiations gave way to both countries suspending their sky-high tariffs. As it currently stands, tariffs on China are expected to stay around 40% through at least mid-November. 
However, the grace period for most other countries has already ended. As of August 7th, the administration imposed significantly higher tariffs on most other trading partners, aside from the seven countries/regions that reached deals with the U.S. But even those countries face higher tariffs relative to the 10% universal rate that was part of the 90-day delay on reciprocal tariffs. 
Along this meandering tariff journey, the administration has also imposed Section 232 tariffs on steel & aluminum (50%), finished autos and parts (25%) and copper (50%). Further tariffs on pharmaceuticals and semiconductors are forthcoming. 
However, the uncertainty train has not stopped there. On August 29th, a federal appeals court ruled that President TrumpÔÇÖs use of the International Emergency Economic Powers Act as grounds for tariffs exceeded presidential authority. The administration is already in the process of appealing the ruling to the Supreme Court, with the federal circuit allowing the current tariffs to remain in effect until the case is heard. But even if the Supreme Court upheld the current ruling, it wouldnÔÇÖt necessarily be an end to TrumpÔÇÖs tariffs. Treasury Secretary Scott Bessent has already suggested that the administration could pursue other means to implement its tariff agenda, though it may require Congressional support. At the same time, the court ruling has no impact on the administrationÔÇÖs Section 232 tariffs. So for the time being, itÔÇÖs status quo.┬á
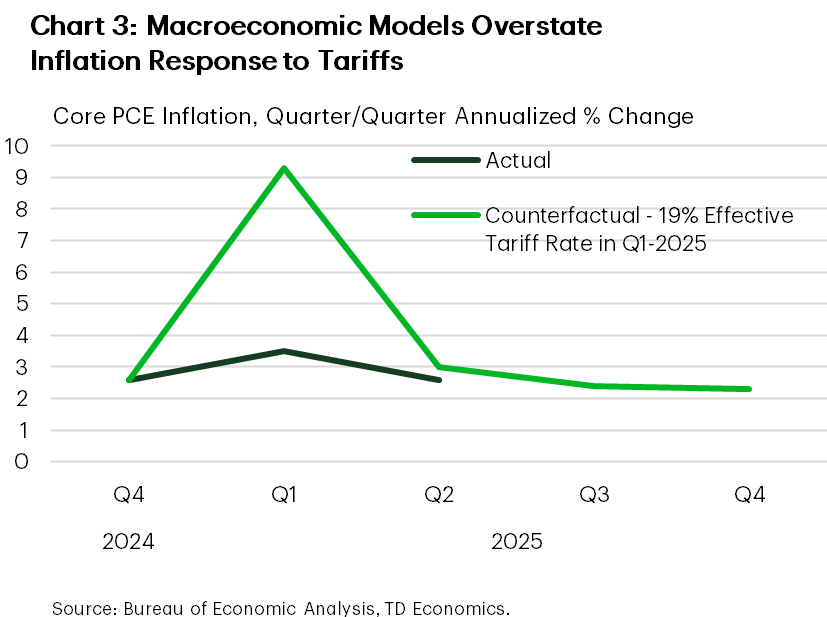
Putting all this together, we estimate that todayÔÇÖs effective tariff rate is close to 19% or nearly a ten-fold increase from its 2024 level and the highest since 1933. Imposing todayÔÇÖs tariff rate in any standard macroeconomic model would generate a massive inflation shock. For example, applying a 19% effective tariff rate in our macro model to construct an alternative inflation scenario predicted that core PCE inflation would go from 2.6% quarter/quarter annualized in Q4-2024 to over 9% annualized in Q1-2025 (Chart 3)! Obviously, core PCE inflation has been far more subdued through the first half of 2025, rising 3.5% in Q1 and even slowing to 2.6% in Q2.┬á┬á
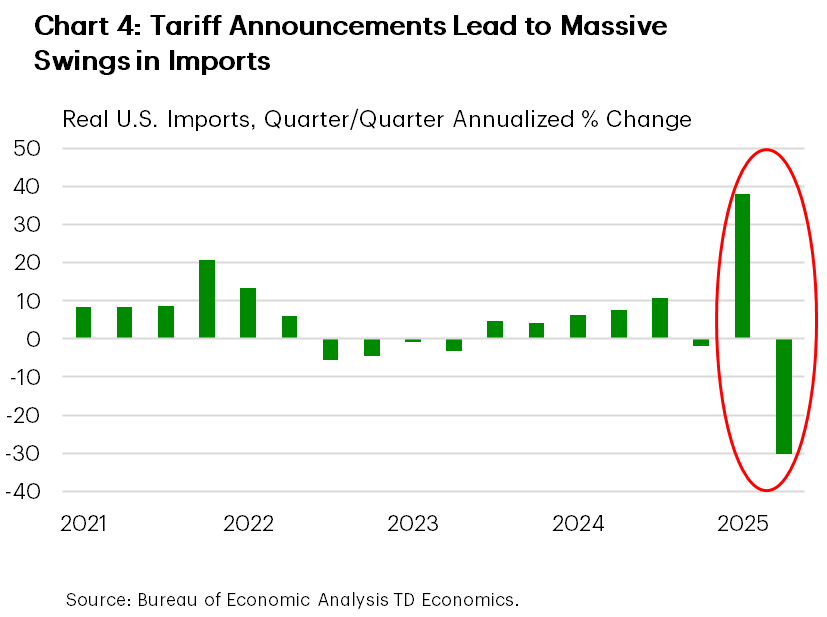
So what gives? Macroeconomic models are not well calibrated for the stop-and-go nature of policies, the complexity of supply chains to absorb some costs along the way, or the uncertainty that can lead to take a wait-and-see approach before adjusting pricing models. But perhaps most importantly, the haphazard rollout of tariff policies with delays, exemptions and special sector carve-outs gave business time to get ahead of the tariffs and stockpile inventories. This was particularly evident in the first quarter, when imports surged by 38% (annualized), shaving nearly five percentage points from GDP growth (Chart 4). Even though higher tariffs have been in play to various degrees since February, businesses have (so far) been able to minimize the impact. And that could easily continue for several months. Even with the most recent tariff reset on August 7th, goods that were already ÔÇ£in transitÔÇØ will be exempt from the higher tariffs through October 5th.┬á
Geographic Shifts Have Also Lessened the Impact
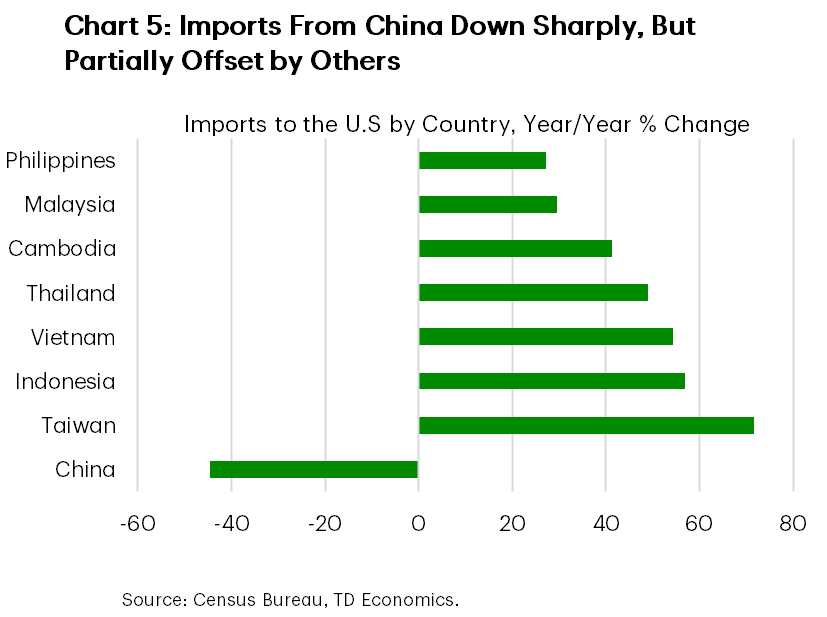
In addition to the inventory stockpiling, businesses have substituted away from countries with higher tariff rates to those with lower rates. The most notable example has been with China. As of June, imports of Chinese goods into the U.S. are down 45% year/year but are up meaningfully across Taiwan and most Southeast Asian countries (Chart 5). 
ItÔÇÖs unclear how much of this is related to a straight substitution versus transshipments of Chinese goods to circumvent the tariffs. We suspect the former has been the predominant driver. Over a third of the pullback in imports from China year-to-date is attributed to one category: computer and electronic products. With Taiwan and other Southeast Asian economies having well developed electronic manufacturing sectors, it seems more likely that the recent shift has been driven by pure substitution effects.┬á┬á
The Trump administration has already taken preemptive steps to clamp down on transshipments. As part of the July 31st Executive Order which re-introduced the broader reciprocal tariffs, it also implemented a punitive 40% (stackable) tariff on any country that tries to circumvent the tariffs by re-routing goods through other countries. While it is unclear how this will be implemented, it highlights that tariff avoidance is on the administrationÔÇÖs radar.
No Evidence to Suggest Exporters are Cutting Costs En Masse
President Trump has often said that other countries will pay the cost of the tariffs, not U.S. businesses. The underlying premise is that exporters will lower their costs to offset the importerÔÇÖs tariff to preserve market share. But this assumes that exporters are working with healthy margins. In reality, overseas manufacturers are operating at razor thin profit margins, leaving little to no room for further price cuts.┬á┬á
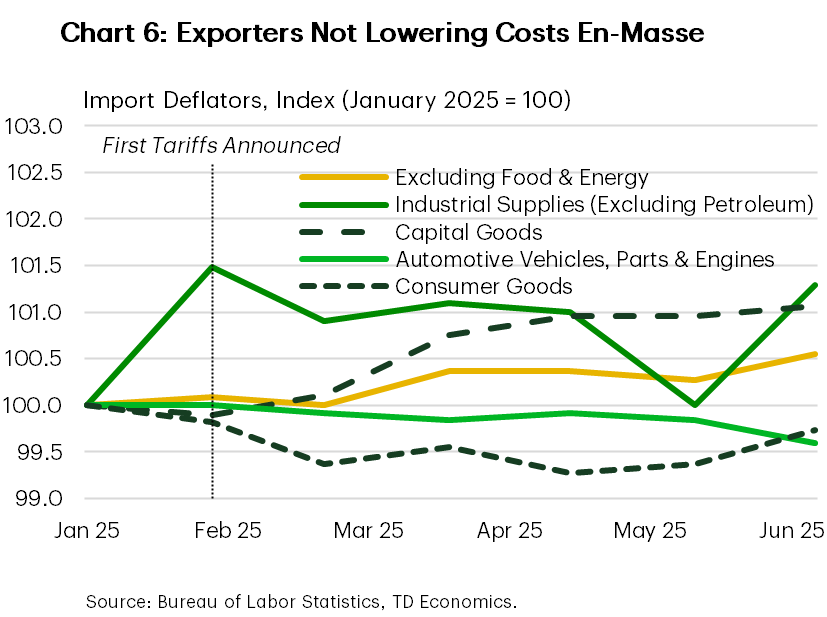
In looking at the ÔÇ£coreÔÇØ import price deflator, which removes the effects of food and energy, thereÔÇÖs little evidence of price discounting (Chart 6). This is particularly true for exporters of capital goods and industrial supplies (excluding petroleum), who have raised prices by 1.2% and 2.1%, respectively year-to-date. At first glance, prices for imported consumer goods have dipped. But pulling history back further shows that this is just a continuation of a broader trend that started last year. In more recent months, prices have shown signs of heating up. Lastly, while import prices for motor vehicles and parts have moved sideways this year, July marked the largest monthly decline in a decade. The timing aligns to recent media reports which have noted that Japanese carmakers have been slashing export prices to remain competitive in the U.S. in the face of higher tariffs.
So what can we take from all this? While there may be some evidence of select suppliers offering price discounts, itÔÇÖs not happening en masse. And certainly not to a degree that would meaningfully offset the tariff costs.┬á
Tariff Impacts Starting to Surface
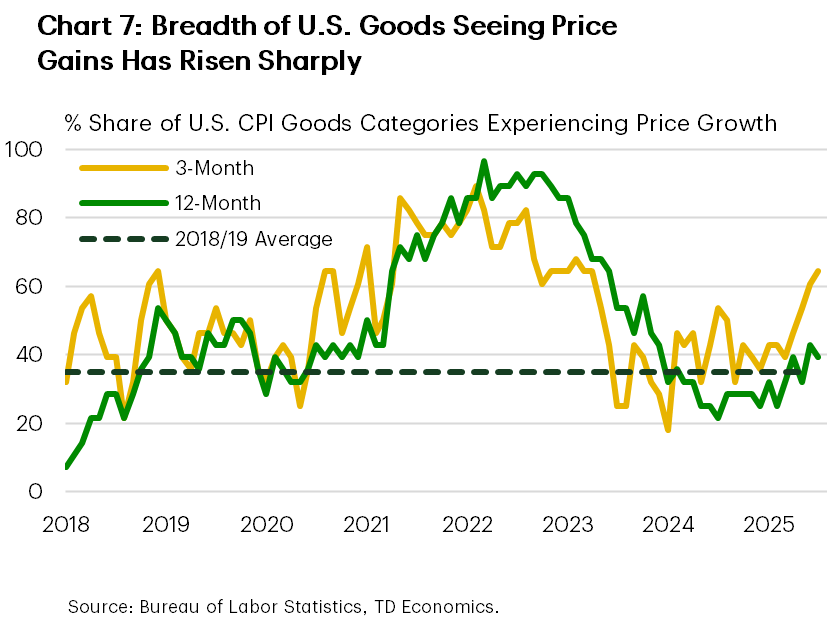
Although the factors discussed above helped to mitigate the degree of tariff passthrough , they certainly havenÔÇÖt eliminated it. The June and July inflation data have shown evidence of goods prices heating up, with core goods rising 1.5% annualized over the three-months ending in July. This is up from 2024, where goods prices were largely flat. Perhaps more telling is the number of goods in the CPI basket now seeing price gains, which have risen to nearly two-thirds, or roughly double its pre-tariff level (Chart 7).┬á
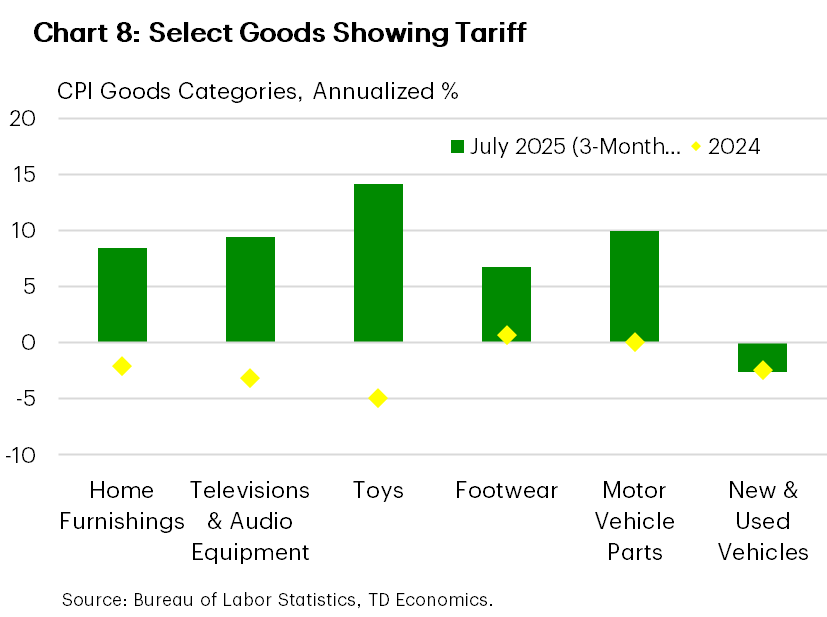
Unsurprisingly, price gains have been largest across those goods most exposed to trade, including home furnishings, televisions & audio equipment, toys, footwear and motor vehicle parts (Chart 8). However, there has yet to be a noticeable pickup in new vehicle prices. This is likely related to a weaker demand for big ticket purchases amid a more uncertain economic environment. This has resulted in dealerships building inventory, which has led some OEMs to offer larger incentives, putting downward pressure on prices. But this isnÔÇÖt expected to last much longer. Dealerships will soon start rolling out 2026 models, and anything not built in the U.S. or that is not USMCA complaint will be facing a tariff ranging from 15-25%. Some portion of this will very likely be passed on to the consumer.┬á
Canada Faster Up, But Quicker to Come Down
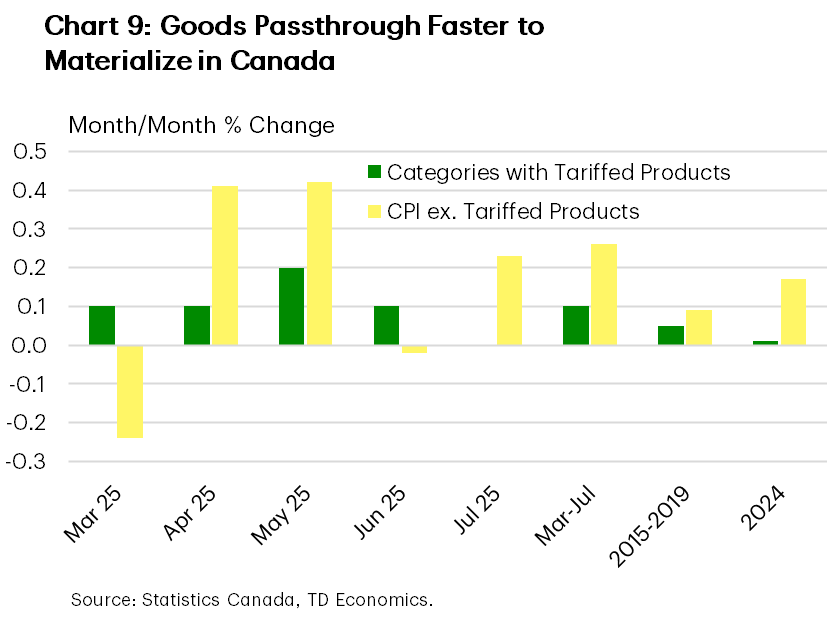
In Canada, price growth picked up after the start of the trade war with a sequence of hot inflation prints pushing out the expected timing for the next Bank of Canada rate cut.┬á At first glance, it looked like tariffs were having a measurable impact on inflation. Grouping Statistics CanadaÔÇÖs 55 main CPI categories into tariff and non-tariff buckets shows the tariffed group contributing an unusually large amount of price pressures through the spring (Chart 9). However, this effect dropped out in July, suggesting the full uptick wasnÔÇÖt entirely driven by tariffs.┬á
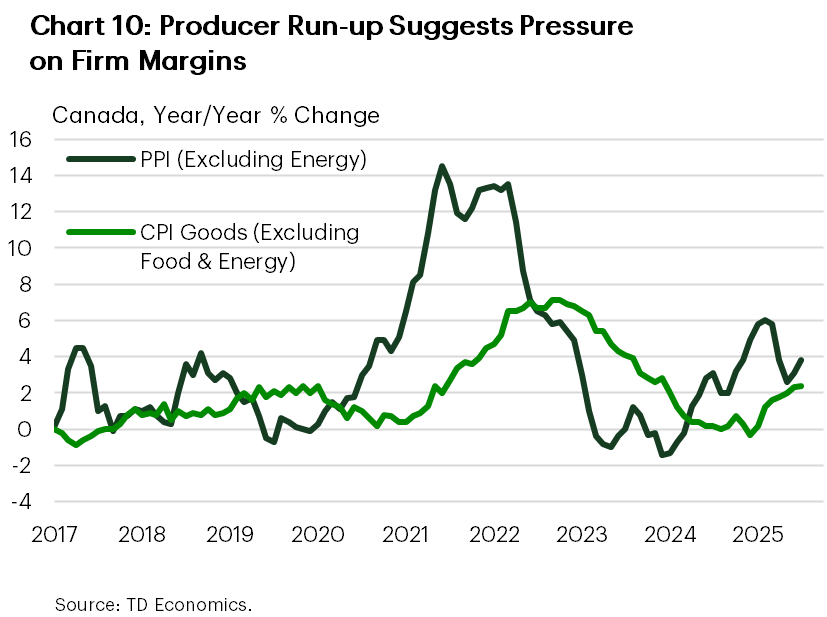
To better understand why, we zoom in on the price of goods excluding energy products. Prices for these products rose 1.3% from March to July. However, this came after a year-long run-up in producer prices (excluding energy), long before any tariff policies existed. In the past, the rise in producer prices has indicated pressures on firm margins and preceded a period of catch-up in consumer prices (Chart 10). 
Estimates based on these historical dynamics suggest that the rise in producer prices (ex. energy) prior to March would have accounted for 0.25 percentage points (pp) of the increase in consumer goods (ex. energy)┬á ┬áprices. The continued push since then has made a similar contribution, taking the total impact on consumer prices to 0.5 pp – or roughly 40% of the total rise in goods prices. Moreover, import prices (beyond energy) have been falling since March. These prices donÔÇÖt include tariffs, but as tariffs are a mark-up on the prices paid by importers, it does suggest that the rise in the PPI since March is not entirely related to Canadian tariffs.┬á┬á
It is worth going through why the tariff effect is likely different in Canada than in the U.S., and different than our prior forecasts. First, CanadaÔÇÖs tariffs have been applied to a much narrower swath of products than those in the U.S., and in a more targeted manner.┬á┬á
The first two tranches of 25% retaliatory tariffs (covering CAD$60 billion worth of U.S. goods in early March) accounted for roughly 8% of imports. These were then expanded to cover non-CUSMA compliant vehicles and the U.S. components of CUSMA- compliant vehicles in early April. Total vehicle imports were another 6% of Canadian imports. However, the specific exclusions of Canadian and Mexican components in CUSMA compliant autos narrowed the scope of the tariffs below this 6% share. Sector specific measures to insulate the steel industry came later and were, again, narrowly applied. The relative restraint by the Canadian Federal government, on both the tariff rate and products covered, helped to mitigate the overall impact to consumers.  
Secondly, while CanadaÔÇÖs tariffs went into effect on the announced dates (potentially leading to immediate price impacts), they have since been scaled back. In the hope of mitigating supply chain disruptions, manufacturers received exemptions on many of their imports. And in September, a broader exemption for U.S. products is due. This will reward retailers and manufacturers that stockpiled inventories and held off on raising prices in the hopes of a d├®tente, potentially further mitigating price gains in the coming months.┬á┬á
So, while Canadian tariffs took effect quickly in March, the rise in consumer prices was likely more an outcome of past margin pressures on companies, rather than recent tariff-related pressures. Looking ahead, CanadaÔÇÖs retaliatory measures could result in a relatively short-lived price adjustment, particularly given recent steadying in the Canadian dollar.┬á
Tip of the Iceberg for the U.S. 
With the post-pandemic bout of inflation still fresh in our minds and U.S. goods inflation now making up some ground, itÔÇÖs natural to wonder how much consumer prices can rise should the current tariff structure remain in place. As we highlighted above, there are many moving parts that can influence the degree of price passthrough. This makes forecasting the potential impact an unenviable job.┬á
Our greatest concern rests with American prices, given the wide scope of products being tariffed and the magnitude that has led to a 19% effective tariff rate. Although we believe consumers have escaped much of the burden, absorbing only a quarter of the passthrough, the sands will shift as inventory stockpiling is drawn down and tariff rates move into a steady state by November. At that point, our forecast assumes 50 % passthrough to consumer prices. Canadian consumers may be on the receiving end of some of AmericaÔÇÖs tariffs as multinationals try to disperse the cost across global customers, but the limited breadth and depth of retaliatory tariffs suggest limited direct effects on consumer prices. In addition, the Canadian domestic demand outlook is weaker than its U.S. counterpart, arguing less scope for companies to adjust prices.┬á
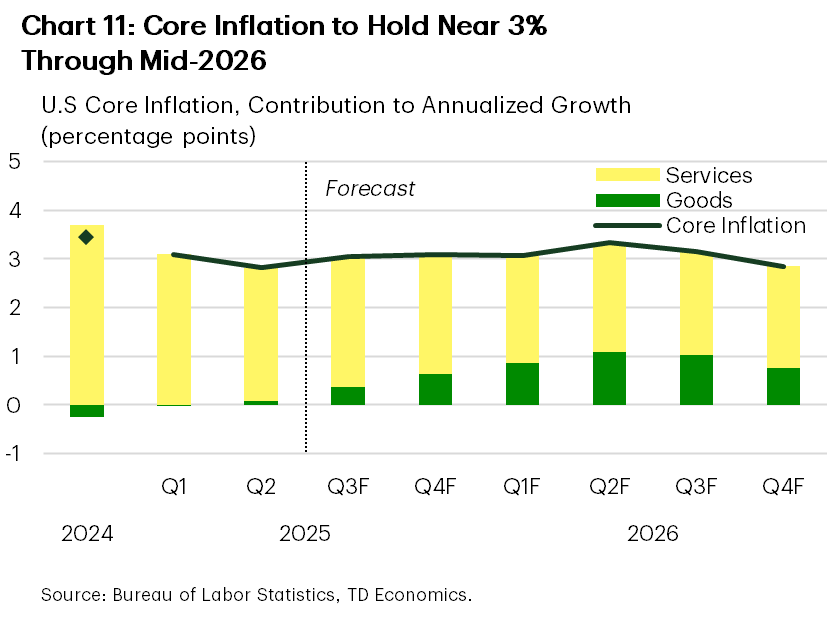
Bigger picture, provided inflation expectations remain well anchored, any price adjustment should serve as a one-time increase to prices. However, because not all businesses are raising prices at the same time, the impact on inflation could be shallower and play out over multiple years. In our forecast, we assumed the quicker one-year adjustment in the price level. With that, U.S. core goods prices rise steadily into 2026, reaching a peak of 4-5% year/year by mid-2026 and could account for one-third of the increase in core inflation. This is considerably less than during the post-pandemic episode, when goods prices peaked at +12% year/year. Provided services inflation continues to cool on trend, it should help to provide some offset, keeping measures of core inflation slightly north of 3% through mid-2026 (Chart 11).