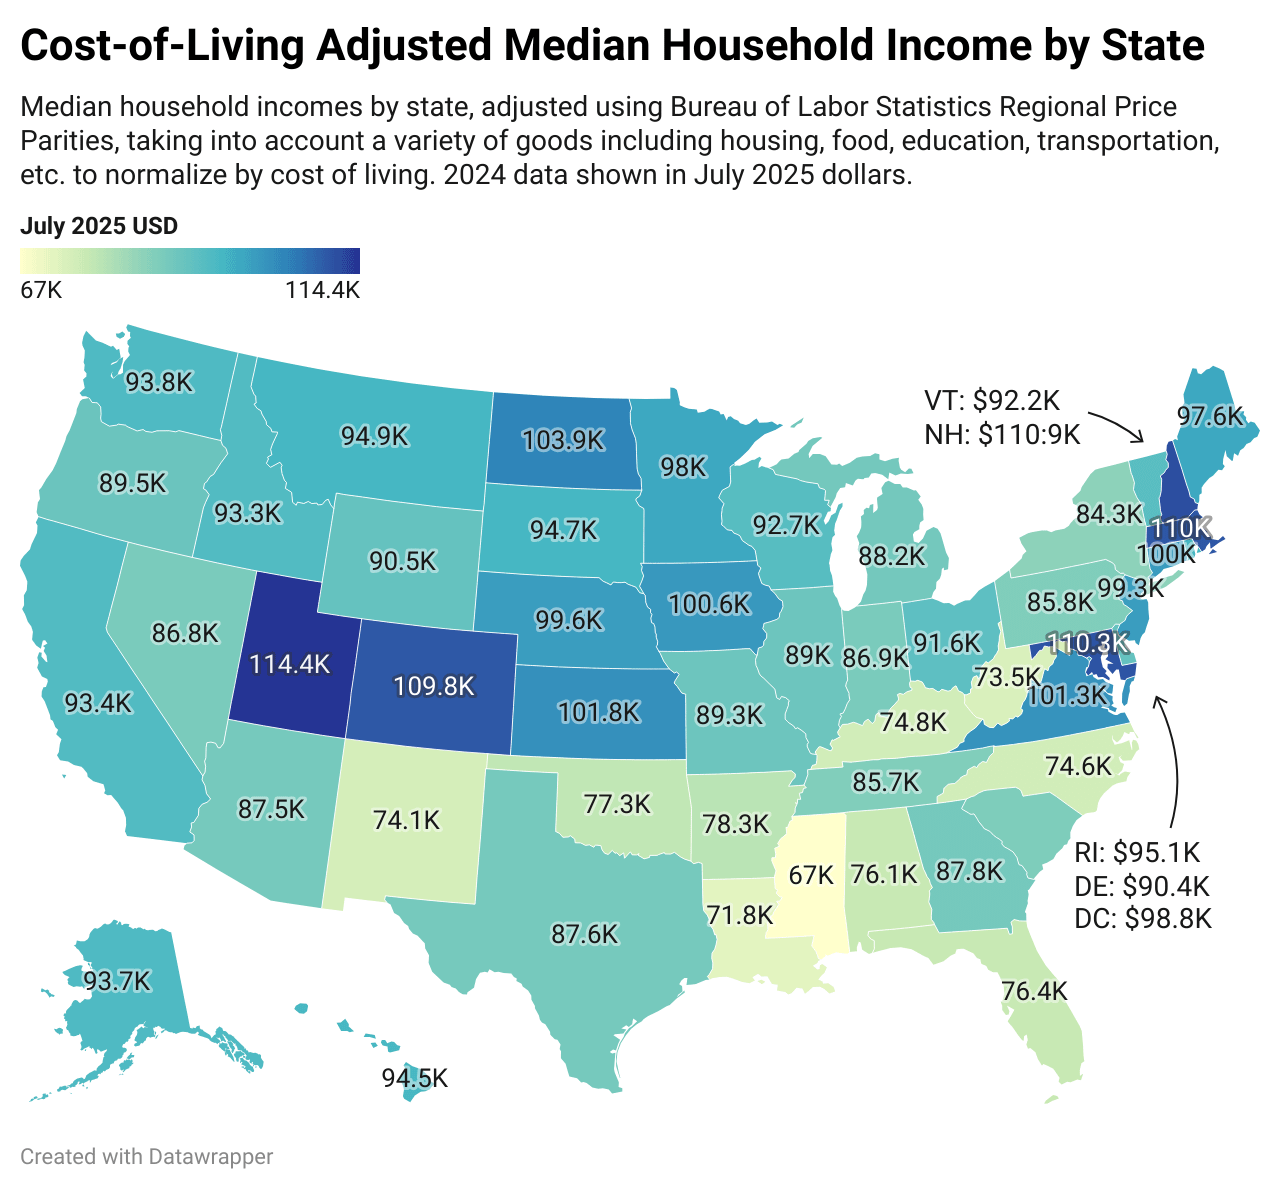
**Median Individual Full-Time Income by State, Cost-of-Living Adjusted**
This map shows 2024 state-level incomes adjusted into July 2025 dollars using the new Census data. Median household incomes are normalised using Bureau of Economic Analysis Regional Price Parities, which account for housing, food, education, transportation, and other goods and services to reflect real purchasing power. Data come from the new Census release of September 2025.
As a New Hampshire resident, yep, we have it pretty good.
One of the top contributors is that businesses get tons of revenue from the neighboring states due to not having a sales tax. Mass, Vermont, and Maine residents constantly travel across state lines, spend their money, and leave.
Really curious how Iowa has a 100k average when I see houses going there for far, far less than they do on the Illinois side of the border.
You could triple my income and I still wouldn’t live in North Dakota or Utah.
How do you factor cost of living in a state like California where it fluctuates so much and the population is greater than most countries?
In San Jose the median home price is 1.3 million (population is about 1 million).
In Fresno the median home price is 416,000 (population 550,000).
How do you factor cost of living from region to region and somehow weight it by population as well?
Anyone know why Utah is so high? Is it tech, mining, both, or something else?
now adjust Utah for the number of kids in the household.
So Mississippi is at 67k, adjusted? But the median household is 54k, and for federal assistance, 59.5k is the minimum on a house of 4 to have their kids fed in school.
Food is near the same if not more expensive than it is in LA. Housing is less expensive that most the US. Education is bare minimum. Transportation hardly exists. What is normalized?
*** glowing numbers. I agree california has a median household around 95k, but household to households with kids is not the same thing?
Someone tell me if I am reading this wrong. The higher the number the more “affordable” per dollar it is? So Colorado, Utah, Maryland, and New Hampshire are the “best” places for the income to cost of living?
Anecdotally, living in CO, that seems off, sure median income is higher than other places, but it sure is expensive here, not compared to SoCal or some places in the NE.
I know the data is correct, but just want to make sure I understand this correctly!
Is it possible to see how each state ranks? I need more justification for why I hate living in Florida so much.
Utah is surprising me twice in two days… wow.
THANK YOU!!!
So tired of seeing charts on here every day with no consideration of COL.
For this to be meaningful you need to have the reference data on hand I think. Having both plots in the same post would make this more impactful.
edit: someone else pointed out that household size matters as well, so I won’t do that here.
Can we do this at the county or MSA level?
This can’t be real how is Kansas so high?
Why is Utah and Colorado so expensive?!
Could you do the ratio of the cost of living median full time income to median household income? This essentially tells us how much stress each earner in a household has to carry
It would be nice if the numbers reflect after tax income.
Can we get this per metro area and not per state? I love the map now but would be interested in how it compares in the metro areas. Denver for example has an extremely high cost of living that isn’t always worth it compared to salaries but since the rest of Colorado is cheaper CO does well here
Not surprised Mississippi…. Seems to be the most consistent one on any map like this
![[OC] Cost-of-Living Adjusted Median Household Income by State](https://www.europesays.com/wp-content/uploads/2025/09/x67nzmr91mof1-1280x1024.png)
23 comments
**Median Individual Full-Time Income by State, Cost-of-Living Adjusted**
This map shows 2024 state-level incomes adjusted into July 2025 dollars using the new Census data. Median household incomes are normalised using Bureau of Economic Analysis Regional Price Parities, which account for housing, food, education, transportation, and other goods and services to reflect real purchasing power. Data come from the new Census release of September 2025.
RPP data from: [https://www.bea.gov/data/prices-inflation/regional-price-parities-state-and-metro-area](https://www.bea.gov/data/prices-inflation/regional-price-parities-state-and-metro-area)
Household data from: [https://fred.stlouisfed.org/release/tables?eid=259515&rid=249](https://fred.stlouisfed.org/release/tables?eid=259515&rid=249)
Made using Datawrapper, calculations in Excel.
I think South Carolina is missing
As a New Hampshire resident, yep, we have it pretty good.
One of the top contributors is that businesses get tons of revenue from the neighboring states due to not having a sales tax. Mass, Vermont, and Maine residents constantly travel across state lines, spend their money, and leave.
Really curious how Iowa has a 100k average when I see houses going there for far, far less than they do on the Illinois side of the border.
Utah has the largest average household size. So before rushing to relocate, note that adjusted per capita income is a [bit different](https://en.m.wikipedia.org/wiki/List_of_U.S._states_by_adjusted_per_capita_personal_income_(2022)) with Utah slightly below average as of 2022.
[deleted]
You could triple my income and I still wouldn’t live in North Dakota or Utah.
How do you factor cost of living in a state like California where it fluctuates so much and the population is greater than most countries?
In San Jose the median home price is 1.3 million (population is about 1 million).
In Fresno the median home price is 416,000 (population 550,000).
How do you factor cost of living from region to region and somehow weight it by population as well?
Anyone know why Utah is so high? Is it tech, mining, both, or something else?
now adjust Utah for the number of kids in the household.
So Mississippi is at 67k, adjusted? But the median household is 54k, and for federal assistance, 59.5k is the minimum on a house of 4 to have their kids fed in school.
https://fred.stlouisfed.org/series/MEHOINUSMSA672N
Food is near the same if not more expensive than it is in LA. Housing is less expensive that most the US. Education is bare minimum. Transportation hardly exists. What is normalized?
** [60% of kids in school qualified for federal assistance in 2020](https://www.npr.org/2021/07/20/1018267303/california-free-lunch-public-schools).
*** glowing numbers. I agree california has a median household around 95k, but household to households with kids is not the same thing?
Someone tell me if I am reading this wrong. The higher the number the more “affordable” per dollar it is? So Colorado, Utah, Maryland, and New Hampshire are the “best” places for the income to cost of living?
Anecdotally, living in CO, that seems off, sure median income is higher than other places, but it sure is expensive here, not compared to SoCal or some places in the NE.
I know the data is correct, but just want to make sure I understand this correctly!
Is it possible to see how each state ranks? I need more justification for why I hate living in Florida so much.
Utah is surprising me twice in two days… wow.
THANK YOU!!!
So tired of seeing charts on here every day with no consideration of COL.
For this to be meaningful you need to have the reference data on hand I think. Having both plots in the same post would make this more impactful.
edit: someone else pointed out that household size matters as well, so I won’t do that here.
Can we do this at the county or MSA level?
This can’t be real how is Kansas so high?
Why is Utah and Colorado so expensive?!
Could you do the ratio of the cost of living median full time income to median household income? This essentially tells us how much stress each earner in a household has to carry
It would be nice if the numbers reflect after tax income.
Can we get this per metro area and not per state? I love the map now but would be interested in how it compares in the metro areas. Denver for example has an extremely high cost of living that isn’t always worth it compared to salaries but since the rest of Colorado is cheaper CO does well here
Not surprised Mississippi…. Seems to be the most consistent one on any map like this
Comments are closed.