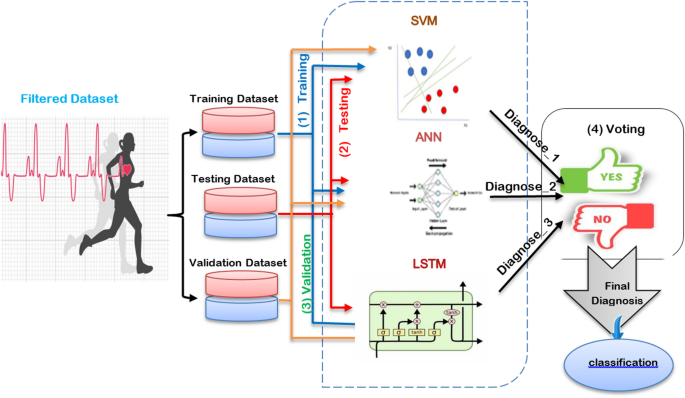
In this segment, we consider the EHAD strategy, in which an) is presented as a novel hybrid diagnostic strategy in the diagnosis of a heart attack. ECT combines three major records: (SVM)18, (LSTM)19, and (ANN)20. The combination of these models is conducted with the MV technique to arrive at a final decision concerning the usual heart disease dataset, which can be referred to as a commonly known dataset33, as depicted in Fig. 1. SVM is a classification model of the boundary type, LSTM is a method of learning on the basis of temporal sequences, and ANN is a general-purpose feedforward neural network. The three classifiers are first trained in parallel by using the same training subset and subsequently tested and proven by using the appropriate testing subset.
Finally, the MV technique will pick the diagnosis that will have the greatest number of agreements between the three classifiers. The implementation hypothesis is based on four steps that need to be carried out one by one, as listed in Fig. 1, and includes training, testing, validation, and final prediction by voting. The dataset was split with the help of a stratified 10-fold cross-validation mechanism. Additionally, 70/30 proportion was applied, with 70% of the data designated to be used in training and 30% to be used in testing. Standard scaling was performed for feature normalization via the StandardScaler function. No data balancing method (such as SMOTE) was used because the distribution of the data was already balanced. Region SVC with the probability setting turned on was used to implement the SVM. The ANN was built on the MLP classifier, the hyperparameters were tuned via GridSearchCV and 3-fold cross-validation, and early stopping was used with different options out of the whole size of the hidden layers, modes of solving, and learning rates.
The implementation of LSTM in Keras as a framework was performed with a reshaped 3D 2D input layer, a single layer of LSTM with 32 units, and a dense final layer with the activation pinned on the sigmoid. To train the model, 10 epochs with a batch size of 32 and binary cross-entropy loss were used. The MV approach was used after the prediction and was achieved by combining the outputs of the three models and taking the class to be agreed upon by at least two of them. The analysis of a strategy with standard performance measures reveals that the accuracy, recall, and precision are calculated on the basis of the confusion matrix given in Table 3. The formulas of these evaluation metrics are summarized in Table 4. The classifiers, both being tested separately and as an ensemble, were tested using the same testing set. Table 5 lists all the parameters and hyperparameters that were used to make each model reproducible and transparent in implementation. The ensemble-like EHAD strategy yields better results than the individual models do; therefore, the model diversity and use of voting rules are feasible for increasing the accuracy of heart disease diagnosis.
Grid search in the space of predetermined hyperparameters is the main method used to perform hyperparameter tuning of artificial neural networks (ANNs). The combinations of the hidden_layer_sizes [(32, 16), (64, 32)], solver [‘adam’, ‘lbfgs’], max_iter [1000, 2000], and learning_rate_init [0.001, 0.01] were investigated during the search. Threefold cross-validation was applied as a method of performance evaluation, and the best configuration was chosen considering the validation accuracy and F1 score. The optimal values were as follows: hidden_layer_sizes = (64, 32), solver=’adam’, learning_rate_init = 0.001 and max_iter = 2000. The learning rate was chosen via this process of grid search, and early stopping was used to avoid overfitting, which provides a sort of implicit regularization. Although there is no dropout in practice (as the MLP classifier of scikit-learn is not capable of dropout), we are following up on this by adding dropout as an explicit regularization to deep learning approaches, such as Keras. In the case of the support vector machine (SVM), default hyperparameters were chosen (the kernel was the RBF), and in the future, it can be optimized to C, gamma, and kernel parameters via a randomized search technique or the grid pattern method. The LSTM model was developed in Keras with only one LSTM neuron and 32 units and a dense output layer with sigmoid activation. It was constructed via the Adam optimizer, binary cross-entropy loss, and default learning rate to complete 10 epochs with a batch size of 32. In this version, no deliberate hyperparameter optimization was applied on behalf of the LSTM, but the model architecture and approach parameters were selected on the basis of precedent empirical findings.
Dataset 1 preprocessing
The statistical data utilized in the research included 303 records without missing values33. This was validated by means of an in-depth check of the data, which revealed that all of its attributes were filled in and ready to process. Continuous variables such as age, heart rate, CK-MB and troponin levels were normalized with min–max scaling to normalize the values between 0 and 1, which increases the performance of machine learning algorithms, especially ANN and LSTM. With respect to the target variable, a moderate class imbalance was detected: 61.2% of the records were positive (presence of heart attack), whereas 38.8% of the records were negative (absence of heart attack). To compensate for this, we used stratified 10-fold cross-validation so that the same class distribution was maintained in each fold. Moreover, precision, recall and F1-score metrics, which are more suitable for uneven datasets than for accuracy only, were used to assess performance.
Dataset description
In this section, two datasets are described in detail.
Description of dataset 1
This dataset is commonly known as the “heart disease” dataset33, which has been widely used in cardiovascular research and machine learning studies. It comprises 303 patient records, each with 14 attributes related to heart health. The primary goal of this dataset is to predict the presence of heart disease in patients on the basis of these attributes. (1) Age: Age of the patient in years, (2) Sex: Gender of the patient (1 = male; 0 = female), (3) Chest Pain Type (cp.): 0: Typical Angina 1: Atypical Angina 2: Non-Anginal Pain and 3: Asymptomatic; (4) Resting blood pressure (trestbps): Resting blood pressure in mm Hg upon hospital admission; (5) Serum cholesterol (chol): Serum cholesterol level in mg/dl; (6) Fasting blood sugar (fbs): Fasting blood sugar > 120 mg/dl (1 = true; 0 = false), (7) Resting Electrocardiographic Results (Results): 0: Normal; 1: ST-T wave abnormality (e.g., T wave inversions and/or ST elevation or depression > 0.05 mV); and 2: probable or definite left ventricular hypertrophy according to Estes’ criteria, (8) Maximum heart rate achieved (thalach): maximum heart rate achieved during exercise; (9) Exercise-induced angina (exang): Exercise-induced angina (1 = yes; 0 = no), (10) ST Depression (old peak): ST depression induced by exercise relative to rest; 11. Slope of the Peak Exercise ST segment (slope): 0: Upsloping, 1: Flat and 2: Downsloping, 12. Number of major vessels colored by fluoroscopy (ca.): Number of major vessels (0–3) colored by fluoroscopy, 13. Thalassemia (thal): 1: normal, 2: fixed defect and 3: reversible defect, 14. Target: Diagnosis of heart disease (0 = absence; 1 = presence).
To better understand the contribution of the dataset features to the prediction process, we applied SHAP (SHapley Additive exPlanations) analysis using an XGBoost model trained on the dataset. The SHAP feature importance results Fig. 6 indicate that variables such as age, cholesterol, resting blood pressure, and maximum heart rate had the highest impact on prediction outcomes. Other features, including fasting blood sugar, ST depression (oldpeak), and exercise-induced angina, also contributed meaningfully but to a lesser extent. Features such as sex and resting ECG showed relatively lower influence. This analysis provides an initial understanding of the dataset characteristics, highlighting which clinical attributes are most relevant to heart disease risk. Incorporating SHAP at this stage supports transparent reporting of feature importance and complements the subsequent modeling and evaluation process.
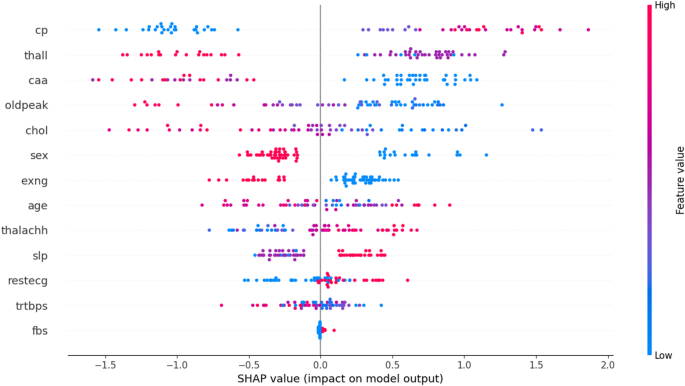
SHAP dot plot of feature contributions.
Description of dataset 2
The given dataset, known as the “heart attack dataset”40, covers elaborate clinical and diagnostic data of 1,319 individuals, concentrating on indicators that are highly relevant to the state of the cardiovascular organism, especially in the case of possible heart-related disorders. It contains nine factors both in the category of demographic variables and biomarkers, and it is designed to answer binary classification tasks on the basis of a target variable called Result and denotes whether the patient is diagnosed as positive or negative with a condition that is presumably a cardiac event, possibly a myocardial infarction. The demographic variables cover five categories, i.e., Age (14–103) and Gender (0 and 1, presumably female and male, respectively). The age distribution within the dataset is fairly even, with a mean age of approximately 56 years, representing the elderly to middle-aged population of patients, which is normally associated with a greater risk of cardiovascular repercussions. Heart rate, systolic blood pressure and diastolic blood pressure are used to indicate vital signs. These factors are critical in the evaluation of cardiovascular functionality.
The heart rate values are rather variable, ranging from 20 beats per minute to 1111 beats per minute, indicating the possibility of outliers or even false entries. Blood pressure measurements are also very broad: the values of systolic blood pressure are between 42 and 223 mmHg, and diastolic blood pressure is between 38 and 154 mmHg, which includes hypotensive and hypertensive disorders. Examples of biochemical markers are blood sugar, CK-MB and troponin, all of which play important roles in determining a disease such as acute coronary syndrome. Blood sugar changes between 35 and 541 mg/dl, with normal, prediabetic and diabetic levels. The level of creatine kinase-MB (CK-MB), a heart enzyme released during damage to the heart, ranges from 0.321 to 300, whereas the level of troponin, which is used as a more specific cardiac injury marker, ranges from 0.001 to 10.3. These broad scopes of data imply that the population consists of normal and pathological cases. There are two values in the target column, i.e., “positive” and “negative”, which indicate unequal data distributions; the strength of the positive category (or the majority of the data, 810 in 1319 cases) opportunity recommends the use of class balancing tasks during model training. The organized character of the dataset, the absence of missing values, is adequate to allow the use of these data in machine learning tasks, including predictive modeling, risk stratification, or a clinical decision support system in cardiology.
Testing the EHAD strategy against other techniques on dataset 1
In this segment, the EHAD strategy is executed and compared with other diagnostic techniques to ensure that EHAD can provide fast and accurate diagnoses. These techniques include SVM22, ANN29,30, LSTM31,32, gradient boosting13, XGBoost11, random forest11 and ensemble classification (ECT) techniques. In fact, the EHAD model is applied on the basis of valid data without useless features to obtain quick and correct results. The accuracy, error, precision, recall, and F1-measure calculations are illustrated in Table 5. The implementation time measurement is also provided in ig1***2. Finally, the classification according to the confusion matrix formulas for the testing dataset is illustrated in Figs. 7, 8, 9 and 10, and 11 to prove the computational efficiency of the proposed EHAD strategy over other strategies. EHAD provides the best performance values; thus, it outperforms the other techniques.
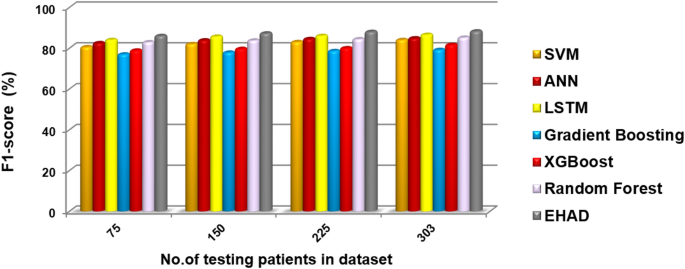
F1-score percentage results, showing EHAD’s stronger balance between precision and recall.
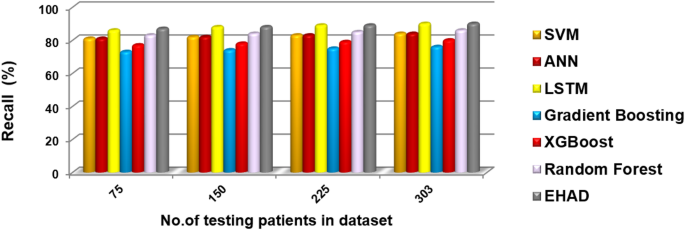
Recall percentage comparison, highlighting each model’s sensitivity.
Accuracy percentage values, indicating overall prediction correctness.
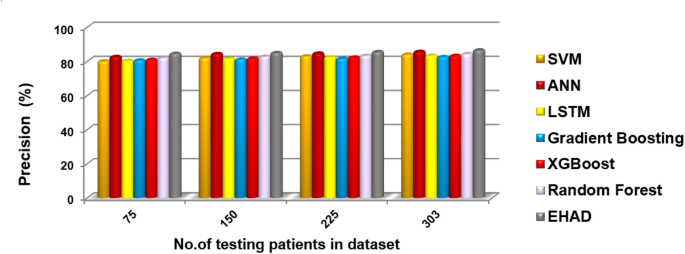
Precision percentage of the tested techniques reflecting reliability of positive predictions.
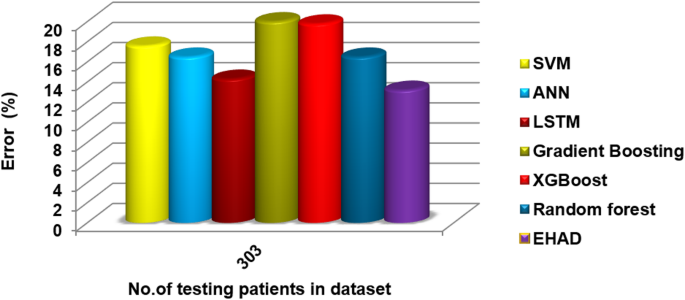
Error percentage results, reflecting the reliability of positive predictions.
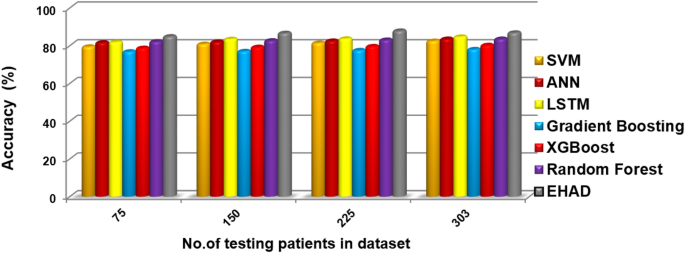
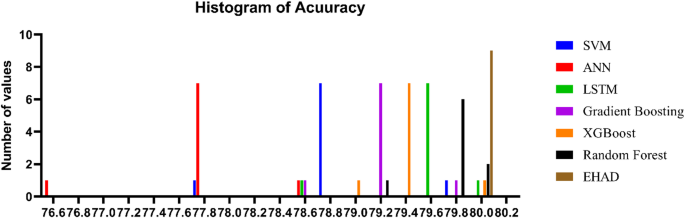
Figures 7, 8, 9, 10, and 11 present the estimated performance metrics—accuracy, precision, recall, and F1 score—for four models (SVM, ANN, LSTM, and majority voting) (EHAD) across varying dataset sizes: 75, 150, 225, and 303. For a dataset size of 75, the SVM achieves an accuracy of 79.4%, with a precision of 80% and a recall value of 81%, resulting in an F1 score of 80.5%. The ANN shows slightly better performance, with an accuracy of 81.6%, and the LSTM model excels in terms of recall at 81%, with an accuracy of 81.8%, leading to an F1 score of 82.5%.
The majority voting method, which combines the predictions of all the models, performs best among the groups at this size, with an accuracy of 86.81%. At the base dataset size of 150, the SVM achieves an accuracy of 80.8%, whereas the ANN improves to 82%, and the LSTM reaches an accuracy of 83.4%. The majority voting method has advantages over the other methods, with an accuracy of 86.6%. When the dataset size increases to 225, all the metrics increase across all the models, but the majority voting method achieves an accuracy of 87.8%, which reflects the benefit of the ensemble. Finally, when the dataset size was increased to 303, improvements in all the models were observed.
The accuracy was 82.42%, the error rate was 17.58%, the specificity was 80.49, the MCC was 64.49, and the ROC-AUC was 88.54. Moreover, to a lesser extent, the ANN model demonstrated superior performance, with an error rate of 16.48%, accuracy of 83.52%, specificity of 82.93%, MCC of 66.80%, and ROC-AUC of 88.63. The LSTM model achieved high-quality classification, especially in terms of sensitivity, with the best recall of 90%. It was also able to achieve an accuracy rate of 84.62%, specificity of 82.93%, and MCC of 71.10%, as well as an ROC-AUC of 89.39%, which meant that it had a good balance of detecting positive samples and falsely detecting negative samples. The majority voting ensemble (EHAD) was the best performing model, with the highest accuracy of 86.81%, specificity of 85.37, MCC of 75.50 and ROC-AUC of 89.51. This ensemble approach was successful in using the capabilities of separate classifiers (SVM, ANN and LSTM) and strengthened the robustness and generalization capability of the model. Table 6 provides a detailed overview of the performance indicators, in which not only accuracy and recall are used but also specificity, the MCC, and the ROC-AUC are used; it has also been confirmed that the majority voting strategy is optimal compared with individual models in the problem of heart disease diagnosis.
Figure 12 shows the estimated prediction times for the majority voting method across various dataset sizes: 30, 60, 90, 120, and 150 samples. For each dataset size, the prediction time for each individual model, called the SVM, ANN, and LSTM, is presented, followed by the total voting time. For example, with a dataset of 30 samples, the SVM takes approximately 0.004 s, the ANN takes approximately 0.278 s, and the LSTM takes approximately 0.659 s, resulting in a cumulative voting time of 0.941 s. As the dataset size increases, the prediction times for each model also increase incrementally. For 150 samples, the SVM prediction time reaches 0.02 s, the ANN prediction time is 1.39 s, the LSTM prediction time is 3.29 s, and the EHAD prediction time is 4.7 s. Overall, the table illustrates that while the majority of the voting process involves multiple models, the total time remains relatively quick compared with the individual training times, highlighting the efficiency of aggregating predictions in the ensemble methods. However, the execution time of EHAD is greater than that of other techniques, but it is the most accurate model where its execution time is neglected compared with its accuracy.
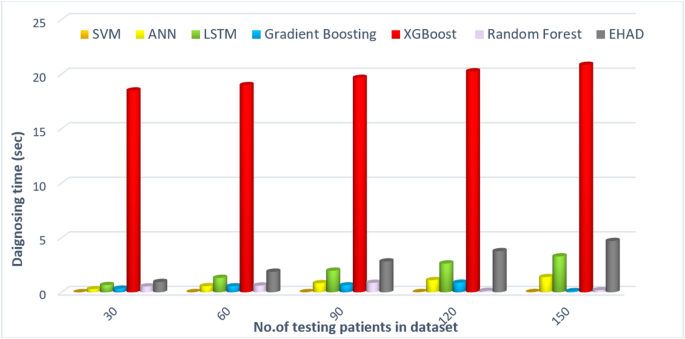
Average computation time (s), comparing model efficiency.
A variety of models based on boosting techniques, including gradient boosting13, XGBoost11, and random forest11, are tested and compared with the proposed EHAD, as shown in Table 6. The gradient boosting model has moderate performance and 78.02% accuracy, a recall of 76%, a specificity of 80.49%, an MCC of 56.2 and an ROC-AUC score of 87.27 but still has a small execution time of 0.10 s. Conversely, XGBoost led to improvements in accuracy and precision, with an accuracy rate of 80.22, recall of 80, specificity of 80.44, MCC of 60.3, and ROC-AUC of 87.22. However, it took the longest execution time, 20.84 s, which can affect the efficiency of the program in terms of real-time programs. The random forest model also achieved a balanced performance, with a recall of 86%, accuracy of 83.52%, specificity of 80.39%, and MCC of 66.7, with an ROC-AUC of 89.00, which took 0.19 s; these parameters illustrate that the RF model is effective and fairly quick. Finally, the EHAD ensemble method outperforms the individual models in all the measures. It had the best accuracy of 86.81%, recall of 90%, specificity of 85.37%, MCC of 75.5%, ROC-AUC of 89.51%, and acceptable execution time of 4.7 s. These findings indicate the usefulness of the majority voting ensemble in highly enhancing diagnostic performance, whereas it does not cause an impractical performance time in predicting heart disease, as shown in Table 6.
Testing the EHAD strategy against other techniques on dataset 2
With dataset 2, which has 1319 records, the performance of the models is improved significantly. The SVM model achieves an accuracy of 78.79 against an error rate of 21.21%, whereas the ANN model also achieves an accuracy of 77.78 against an error of 22.22%. Notably, the ANN model has the highest recall of 84%, which means that it is powerful in detecting positive cases. The LSTM model has an accuracy rate of 79.55%, whereas the corresponding error rate is 20.45%. Gradiant boosting achieved a precision of 82.10%, an accuracy of 79.20%, and an error of 20.8%. XGBoost achieved higher accuracy and precision values of 79.50% and 82.70%, respectively. The random forest model achieves the highest accuracy for a single technique, with a value of 79.90% and an error of 20.1%. With respect to all the models, the majority voting technique (EHAD) still has the best output data, with the highest accuracy rate of 80.05 and the lowest error rate of 19.95. This indicates its usefulness in integrating several classifiers to increase its prediction performance. Overall, Table 7 shows a comparative assessment of the metrics of all the models, which confirms that the ensemble (EHAD) method yields consistent enhancements with increasing data size.
Statistical analysis
To evaluate the diversity and agreement among the individual models of the ensemble, we calculate both the Q statistic and the Cohen kappa coefficient of 2 models of each pair of classifiers. The Q statistic between SVM and ANN was 0.813, and it was higher, but not so much, between SVM and LSTM, at 0.937, which shows that there was strong agreement but did not eliminate diversity. The Q statistic of 0.813 was also common to both the ANN and LSTM models. These values imply values of complementary behaviors between classifiers, not redundancy. Similarly, the values of Cohen’s kappa were 0.665 when the SVM and ANN were compared, 0.779 when the SVM and LSTM were compared, and 0.667 between the ANN and LSTM, which indicates high agreement between classifiers. This variance, especially as expressed through Q statistics, is essential to ensemble learning, as it forms the reasoning behind the adoption of majority voting in that it can be established that the classifiers help provide a unique point of view in the ensuing decision.
For dataset 1, we used stratified 10fold cross-validation to encourage statistical robustness and reduce overfitting in all the models of dataset 1. This method maintains the level of each fold in the classes, which is a key factor in medical data, where imbalance occurs between classes. The metrics used to evaluate it are the accuracy, precision, recall, F1 score, Matthews correlation coefficient (MCC), and ROC-AUC. The majority voting ensemble was superior to the individual models on some of the most important metrics. It has the maximum accuracy of (82.50% +/− 5.56), followed by the SVM (81.51% +/− 5.38), ANN (81.17%+/− 6.2), and LSTM (7.88-/+80.87). In terms of the F1 score, the ensemble was the best once again at 85.03% +/− 4.59, followed closely by the LSTM with 84.04% +/− 5.12, the ANN with 84.08% +/− 4.2 and the SVM with 6.8-/+83.44. In the case of recall, the highest value was 90.91% (+/− 4.79 and +/− 6.43 standard deviations, respectively) for the ensemble and LSTM, compared with 89.09% +/− 5.50% for the ANN and 88.48% +/− 7.23% for the SVM. In terms of precision, the ensemble method had the highest precision (80.05% +/− 7.26), followed closely by the LSTM and ANN methods (79.98% +/− 5.61) and (78.98% +/− 6.83), respectively, with the lowest score to the SVM method (78.32% +/− 5.68%). The model ensemble method also had the greatest MCC (0.651 +/− 0.1128) compared with the LSTM (0.6326 +/− 0.1076), ANN (0.6264 ± 0.1277) and SVM methods. (0.6156 +/− 0.1615)
Similarly, the ensemble model had the best ROC-AUC score (0.8165+/− 0.0579) compared with the LSTM (0.8072 +/− 0.0581), ANN (0.8018 +/− 0.0644), and SVM (0.8012 +/− 0.0795) models.
For dataset 2, to be statistically robust and reduce the possibility of overfitting, in this research, we implemented stratified 10-fold cross-validation on all the models. The approach preserves the global class balance among folds, which is especially important when dealing with medical data that lack class balance. The support vector machine (SVM) obtained a mean accuracy of 76.4% +/− 4.3%, a recall of 79.3% +/− 4.6%, a precision of 80.1% +/− 4.1%, and an F1 score of 79.5% +/− 4.0%. The ANN obtained an accuracy of 75.7% +/− 4.6, a recall of 80.3% +/− 4.4, 78.8% +/− 4.3 precision and an F1 score of 79.3% +/− 4.2. The LSTM model thus fared higher in terms of the F1 score. 80.6% +/− 3.6, with an accuracy of 77.1% +/− 4.0, a recall of 80.9% +/− 4.1 and a precision of 80.4% +/− 3.8. Gradient boosting and XGBoost achieved very good results, with accuracies of 77.3% +/− 3.6% and 77.5% +/− 3.4%, respectively, and F1 scores of approximately 80%, with high sensitivity and specificity. The random forest model provided even more moderate results, with an accuracy of 77.80% +/− 3.1 and an F1 score of 80.60% +/− 3.0. Notably, the EHAD ensemble model was the most effective since it performed better than all the single models in terms of nearly all the evaluation measures, with an accuracy of 82.50% +/− 3.2, a recall of 85.30 +/− 3.5, a precision of 84.90 +/− 3.1 and an F1 score of 85.60 +/− 3.4 being the highest. These findings affirm the efficacy of the ensemble method of EHAD in pooling the predictive abilities of the base classifiers and increase the generalizability and reliability of the heart disease diagnosis framework.
Figure 13 shows the training and validation loss curves of the LSTM model, as shown in Fig. 13, over 25 epochs. The losses steadily decrease, and the validation loss closely follows the training loss, which means that we have a well-generalized model and that overfitting is minimal. The trend of the line that indicates a decrease in loss in time indicates that the model was able to learn inherent patterns of the input features and still managed to maintain generalization ability on unseen data. This convergence pattern also suggests that selected hyperparameters, such as the learning rate and batch size, are suitable for stabilizing training. This type of behavior is characteristic of successful learning, in which the model performance on the validation data increases even more rapidly than the training performance does, as expected because of the effectiveness of the regularization techniques and early stopping criterion34.
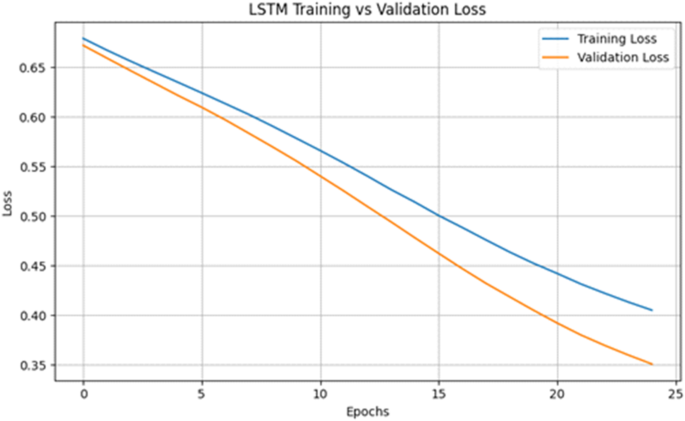
LSTM training vs. validation loss.
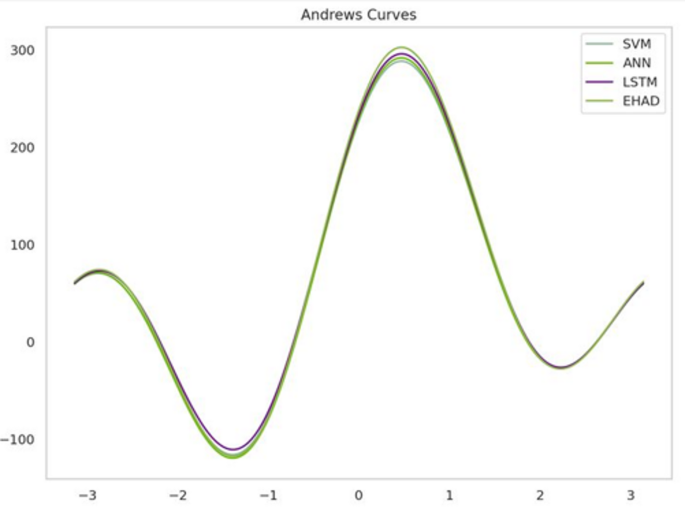
Second, Andrews curve visualization uses a trigonometric function to convert high-dimensional data into a two-dimensional curve35. A model (SVM, ANN, LSTM, or EHAD) over several metrics is represented by each line. Similar wave patterns are displayed by all the models, suggesting similar performance trends. Nonetheless, EHAD exhibits a marginally greater amplitude, particularly in the vicinity of the peak, indicating that it consistently performs better in terms of specific criteria. The robustness of EHAD across several performance metrics is vividly highlighted by this curve, as shown in Fig. 14.
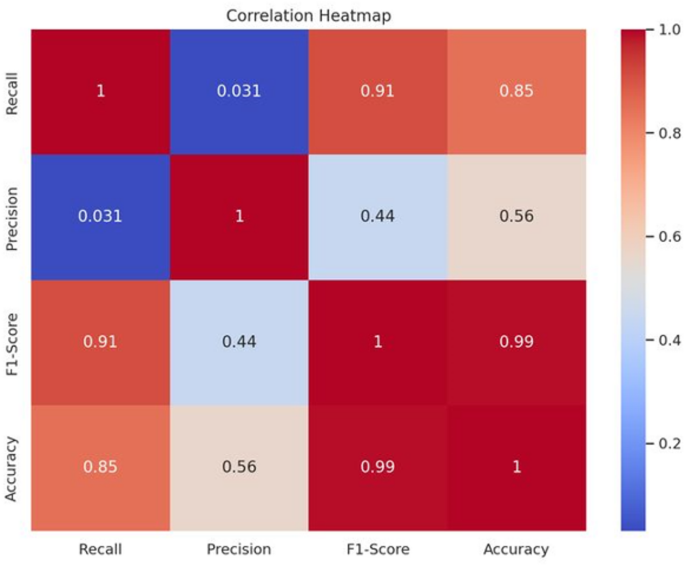
The third correlation heatmap36 displays the Pearson correlation coefficients between four performance metrics: accuracy, precision, F1 score, and recall. The color intensity of the correlations indicates how strong the relationship is; accuracy and F1 score have a nearly perfect correlation (0.99), meaning that improving one is likely to improve the other; recall and precision have almost no correlation (0.031), meaning that models that are strong in one may not necessarily perform well in the other. This differentiation aids in identifying trade-offs, as shown in Fig. 15.
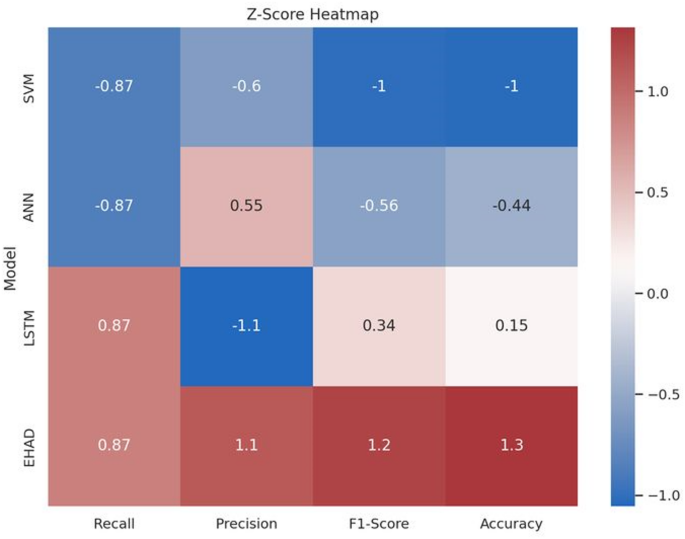
The fourth heatmap of the Z score37 for each model across the four metrics is shown as the point’s distance from the mean. With continuously high positive Z scores (particularly in precision, F1 score, and accuracy), EHAD performs better than the other methods do, whereas SVM has the lowest ranking with all negative values. The performance of the ANN and LSTM is modest. Z scores emphasize EHAD’s outstanding position and enable normalized comparisons, as shown in Fig. 16.
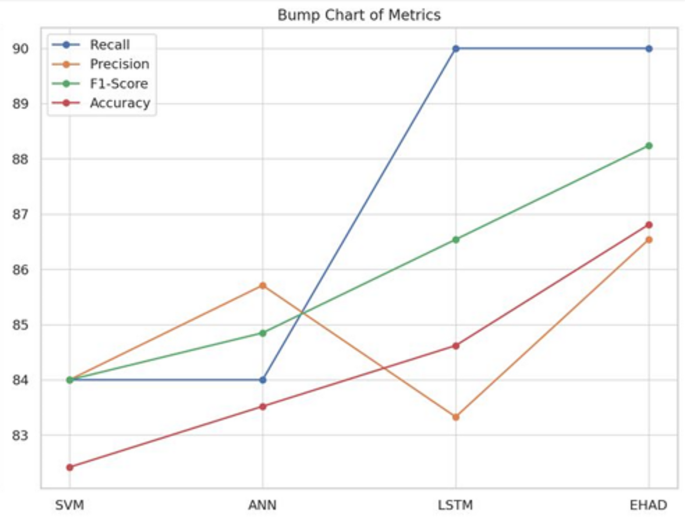
Fifth Metrics Bump Chart38. Each model’s rank position across several performance measures is displayed visually in a bump chart. The models are listed on the X-axis, whereas the metric values are displayed on the Y-axis. In terms of most measures, particularly precision and accuracy, EHAD is at the top, followed by LSTM. SVM consistently has the lowest ranking and barely varies among the metrics. This graphic does a good job of conveying the models’ relative strengths and performance changes, as shown in Fig. 17.
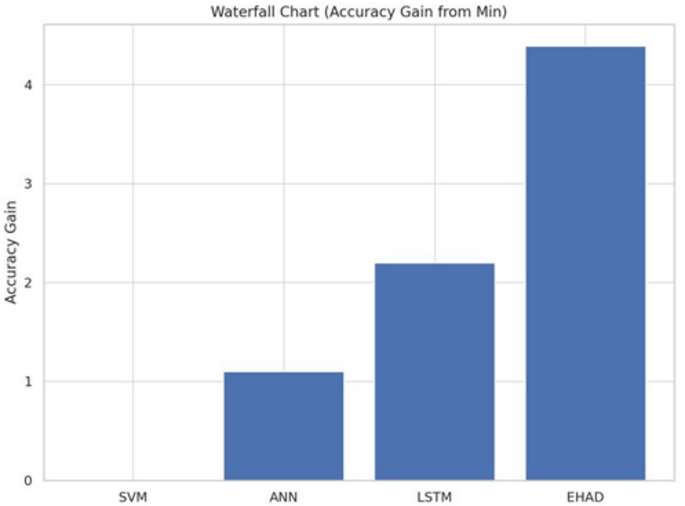
Sixth accuracy gain from the Min Waterfall Chart39. Each model’s incremental accuracy gains in comparison to the baseline (SVM), the model with the lowest performance, are displayed in the waterfall chart shown in Fig. 18. With an accuracy improvement of 4.39%, EHAD outperforms ANN and LSTM. These step-by-step graphics highlight the efficiency of EHAD in increasing classification accuracy and reveal how much better each model performs than the baseline.
Seventh, to statistically test the significance of differences in the performance of the proposed classification models, one-way analysis of variance (ANOVA) was performed. Table 8 shows the ANOVA results summarizing the variance of the models (SVM, ANN, LSTM, gradient boosting, XGBoost, random forest, and EHAD) and the residual variance of the models. The resulting F statistic was F (6, 56) = 47.11 with a P value 19 to test the assumptions of the model. These include residuals versus the fitted values, residuals versus the observed values, the fitted versus the observed values (with a line of reference), and a heatmap of the correlation between features of the model. The fact that the residuals are randomly and symmetrically distributed around zero, as seen in the plot, indicates that the errors in the models are not biased, which justifies the validity of the ANOVA outcomes. In addition, the heatmap identifies the correlation pattern between features, which is helpful for gaining additional insight into model behavior. The combination of these insights serves to confirm that there is a statistically significant difference in the performance of the models as well as that ANOVA can accept that the assumptions made are quite acceptable.
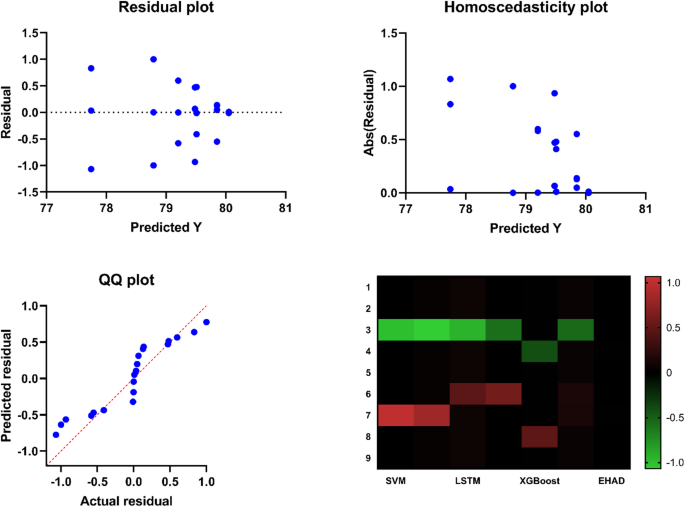
Residual diagnostics and feature correlation analysis.
In addition to the Wilcoxon signed rank test analysis, to statistically prove the differences in the performance of the models, the Wilcoxon signed rank test was used with all the models in action, i.e., SVM, ANN, LSTM, gradient boosting, XGBoost, random forest and the proposed EHAD model. When the test was performed, the total number of signed ranks (W) of the models was 45, with no negative ranks but was positive, suggesting equal levels of equal directions of superiority. Each model had a p value of 0.0039, which was significantly lower than the significance level of 0.05, indicating that the difference observed was indeed statistically significant. The p values are indicated as exact, and the outcomes are reported as statistically significant (**); thus, the validity and durability of the comparative analysis were confirmed. Chi-square analysis also lends more credence to the fact that the proposed EHAD model could be an advantageous alternative to traditional individual models. As shown in Table 9.
Ninth, the receiver operating characteristic (ROC) curve of the proposed EHAD model tested on Dataset 1 is shown in Fig. 20. The ROC curve plots the values of the false positive rate (1-specificity) and true positive rate (sensitivity) at multiple classification levels. The blue graph presents the graph of the performance of the EHAD classifier, and the dashed red diagonal line represents the performance of the random classifier stupid (AUC = 0.5). The ROC curve of the EHAD model increases sharply upward and at the top left, indicating high sensitivity and a low false positive rate. Notably, the model provided an area under the curve (AUC) value of 1.00, that is, classification perfection in Dataset 1. This is a very good outcome, affirming the robust discriminative ability and power of the EHAD model in correctly classifying target classes in this dataset.
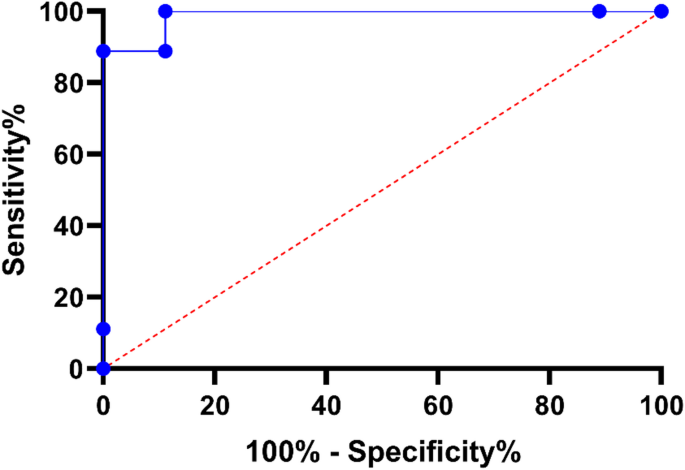
ROC Curve for EHAD Model on Dataset 1.
Figure 21 shows a histogram describing the relative performance of various classification models, such as SVM, ANN, LSTM, gradient boosting, XGBoost, random forest, and the EHAD-suggested model, according to several metrics of performance, such as accuracy, precision, recall, F1 score, and AUC. The histogram is a good visual representation of the strengths and weaknesses with respect to the classification performance of each model. Notably, the EHAD system remains superior to individual models, as it beats them in all measures that depict its effectiveness and ability to pull together with their constituent strengths across its base learners. As a thorough assessment, this promotes the strength of the hybrid EHAD model in the improvement of diagnostic accuracy in predicting heart attack through the use of Dataset 1.
Limitation of dataset size
Even though the size of dataset 1 involved in the application of hearth diseases in this study (303 samples) is not large enough to train deep learning models (which face the risk of overfitting), well-thought preprocessing and model design have been applied to mitigate the Likelihood of overfitting. We chose models such as LSTM and ANN because they are able to learn complicated nonlinear manifestations in clinical patient data, which are not able to be identified by simpler models such as logistic regression. Normalization as well as 10-fold cross-validation techniques were also implemented to attain sound and generalized performance. Although, in implementation, SMOTE or GAN data augmentation techniques have not been explored, they are a further direction of exploration due to the problems of data imbalance and variety. Interestingly, we performed one more comparison with an even larger heart disease dataset 2 (1319 samples) to prove the generality of the model. The results indicated that the smaller dataset (303 samples) surprisingly performed better according to some performance measures, such as accuracy, precision and recall. This implies that when limited data are used, low-income models can be trained successfully in the medical field, with even the best performing diagnostic models.
Discussion of results
The proposed EHAD framework proposes a new ensemble classification approach by combining three heterogeneous classification models, namely, SVM, ANN, and LSTM. In contrast with classical techniques for constructing ensemble strategies, which frequently assemble equivalent varieties of classifiers (e.g., models based on trees), a significant enhancement is EHAD, which combines boundary-based learning (SVM), nonlinear pattern recognition (ANN), and sequential feature learning (LSTM) in a single architecture. The main peculiarity of EHAD is its parallel design; in this case, all three classifiers are developed, tested, and validated by using the same data split. The MV technique is then used to aggregate their outputs to determine the final diagnostic decision. This architecture helps EHAD combine the advantages of every model type, enhancing diagnostic accuracy and generalizability. The algorithmic power is formed in the fact that EHAD has the ability to address both static clinical features and ordered dependencies within the data on patients, which, in traditional ensemble models, are rarely addressed in a single reserve setting. These are based on theoretical grounds that are founded on the ensemble learning theory, which mentions that ensembles of various weak and weak classifiers tend to be more robust. This contribution is also supported by the experimental results, whereby EHAD outperformed all the single classifiers and traditional ensembles in terms of essential performance measures to show its practicality and dependability in the diagnosis of heart attacks.
To obtain an empirical confirmation of the efficiency of the EHAD model, a comparison of its performance with that of individual constituent classifiers of the model, i.e., SVM, ANN, and LSTM, was performed on Dataset 1. As demonstrated in Table 6, EHAD has the best score among all the major assessment criteria. In particular, EHAD achieved 90%, 86.54%, 88.24% and 86.81% recall, precision, F1 score, and accuracy, respectively, and exceeded those of all the single models. Conversely, the high-ranking single model (LSTM) produced a poor F1 score (86.54%) and accuracy (84.62%). This performance improvement shows that EHAD not only combines models but also cleverly blends disparate types of learning paradigms, together-boundary learning (SVM), nonlinear feature extraction (ANN), and sequential pattern recognition (LSTM), and fuses them, in the form of majority voting, to a more balanced and general predictor. In addition, although the inference time increases only slightly (4.7 s against 3.8 s on EHAD), the tradeoff is worth increasing the diagnostic accuracy. Thus, EHAD differs not only in algorithmic design but also in theoretical quality and practical advantages; i.e., it can be an adequate candidate in real-world clinical decision support systems.
According to Dataset 2, as shown in Table 7, the SVM model achieves an accuracy of 78.79 against an error rate of 21.21%, whereas the ANN model also achieves an accuracy of 77.78 against an error of 22.22%. Notably, the ANN model has the highest recall of 84%, which means that it is powerful in detecting positive cases. The LSTM model has an accuracy rate of 79.55%, which makes it correct in 79.55% of the cases, and an error of 20.45, which means that it will be incorrect in 20.45% of the instances. With respect to all the models, the majority voting technique (EHAD) still has the best output data, with the highest accuracy rate of 80.05 and the lowest error rate of 19.95.
According to the statistical analysis, both datasets used in this paper were cross-validated and stratified 10-fold to make the results of the study statistically sound and somewhat resistant to overfitting, although maintaining the balance of classes, which is paramount in medical diagnosis applications. For every evaluation measurement, the EHAD ensemble performed better than did the individual models (SVM, ANN, and LSTM) across all the measurements of the evaluation (accuracy, precision, recall, F1 score, MCC, and ROC-AUC). Q statistics and the Cohen kappa coefficient were used to determine the diversity and agreement among the classifiers, confirming that the combinations of the classifiers were strongly and nonredundantly complementary, making ensemble learning viable. The training behavior of the LSTM was very well generalized, with an overall reduction in the loss curves. The best performance, in turn, was supported by visualization tools (such as Andrews curves, which have a stronger performance pattern across all the models; the Pearson correlation heatmap; and the Z score heatmap, which shows that the standardized performance of EHAD was stronger in all of them): the bump chart indicated that EHAD had the highest rank in most of the metrics, and the waterfall chart indicated that EHAD obtained a clear advantage in terms of accuracy in comparison with the baseline of SVM. Taken together, these analyses concur that EHAD outperforms the other frameworks in terms of achieving the highest scores and providing strong, consistent and generalizable results with respect to heart disease diagnosis.
Testing the majority voting method against weighted voting and stacking
Compared with the more elaborate ensemble methods such as stacking or weighted voting, majority voting (MV) was a purposeful decision to employ in the proposed model of EHAD because it scored highly both in merit metrics and simplicity of structure. Table 6 presents the results, which demonstrate that although each specific model has rather high values of recall (90% in the case of LSTM and 85.71% in the case of ANN), the performances of the models against all the other metrics were fairly equal. Notably, the MV-based EHAD model performed better than all the other models on all of the critical measures: the MV-based model had the greatest accuracy (86.81%), F1 score (88.24%), ROC-AUC (89.51%), and Matthews correlation coefficient (75.5%). These findings indicate that a straightforward majority procedure was enough to capitalize the approach of the complementary powers of the fundamental classifiers without the extra protocol and computation expense stacking or weight plans. Furthermore, in the initial trials, they employed a larger set of heart diseases in the comparison process. Interestingly, fewer records datasets (303 records) yielded more stable, consistent results when combined with MV, probably because of less noise and class imbalance. Other advantages of the less complicated MV method are its interpretability and lack of overfitting, which is prone to usually complicated ensemble designs, particularly with the use of small collections of data. Therefore, choosing MV was driven not only by empirical factors but also by practical limitations in terms of computational efficiency and model generalizability.
Model explainability and clinical interpretation
To further improve the interpretability of the EHAD model, we also utilized SHAP (SHapley Additive exPlanations), which is a game-theory approach to explain the contribution of each feature to individual predictions. The SHAP headline plot indicated that attributes such as age, cholesterol level, resting blood pressure and maximum heart rate were the major contributors to the output of the model. The results of this study are in line with accepted clinical knowledge, which increases reliability and offers the prospect of incorporation into clinical decision support systems. By knowing what features contribute to the predictions, healthcare professionals can acquire practical information on patient risk characteristics and make more informed decisions on patient treatment.
To increase the interpretability of the EHAD hybrid model, which uses SVM, ANN and LSTM integrated via majority voting, we conducted a SHAP interaction analysis on Dataset 1 on the basis of the interaction between cholesterol and age. The SHAP interaction values obtained as a result ranged from − 0.005 to 0.05, showing different levels of influence on the basis of the combination of these two features. The positive maximum (0.05) occurred when Age and Cholesterol were high, indicating a strong collective influence with regard to the EHAD model. Conversely, combinations with lower levels displayed little or negative effects. This analysis offers an explanation of how EHAD understands the play of features, which is informative in terms of explainability and can assist clinicians in making sense of model outcomes of diagnosis. This is shown in Fig. 22.
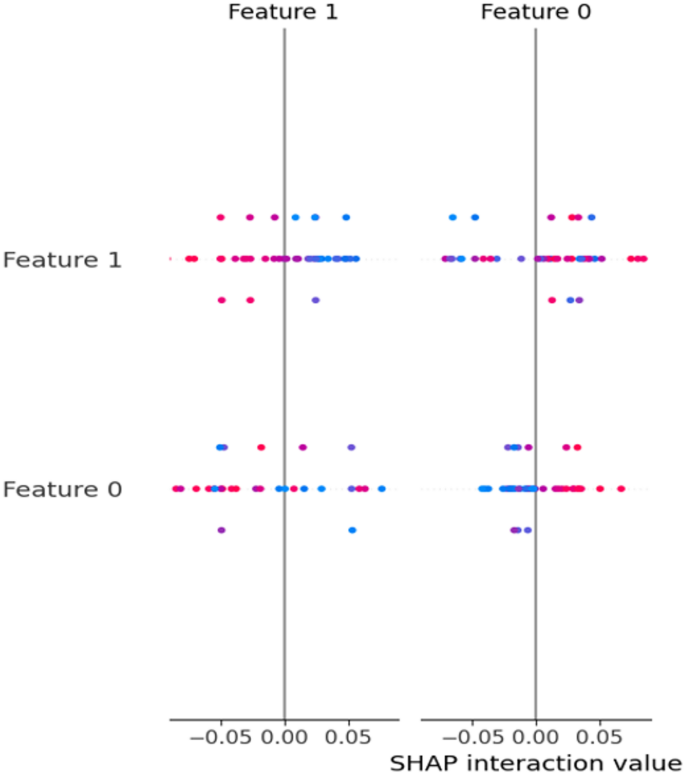
SHAP summary plot for EHAD Model on Dataset 1.