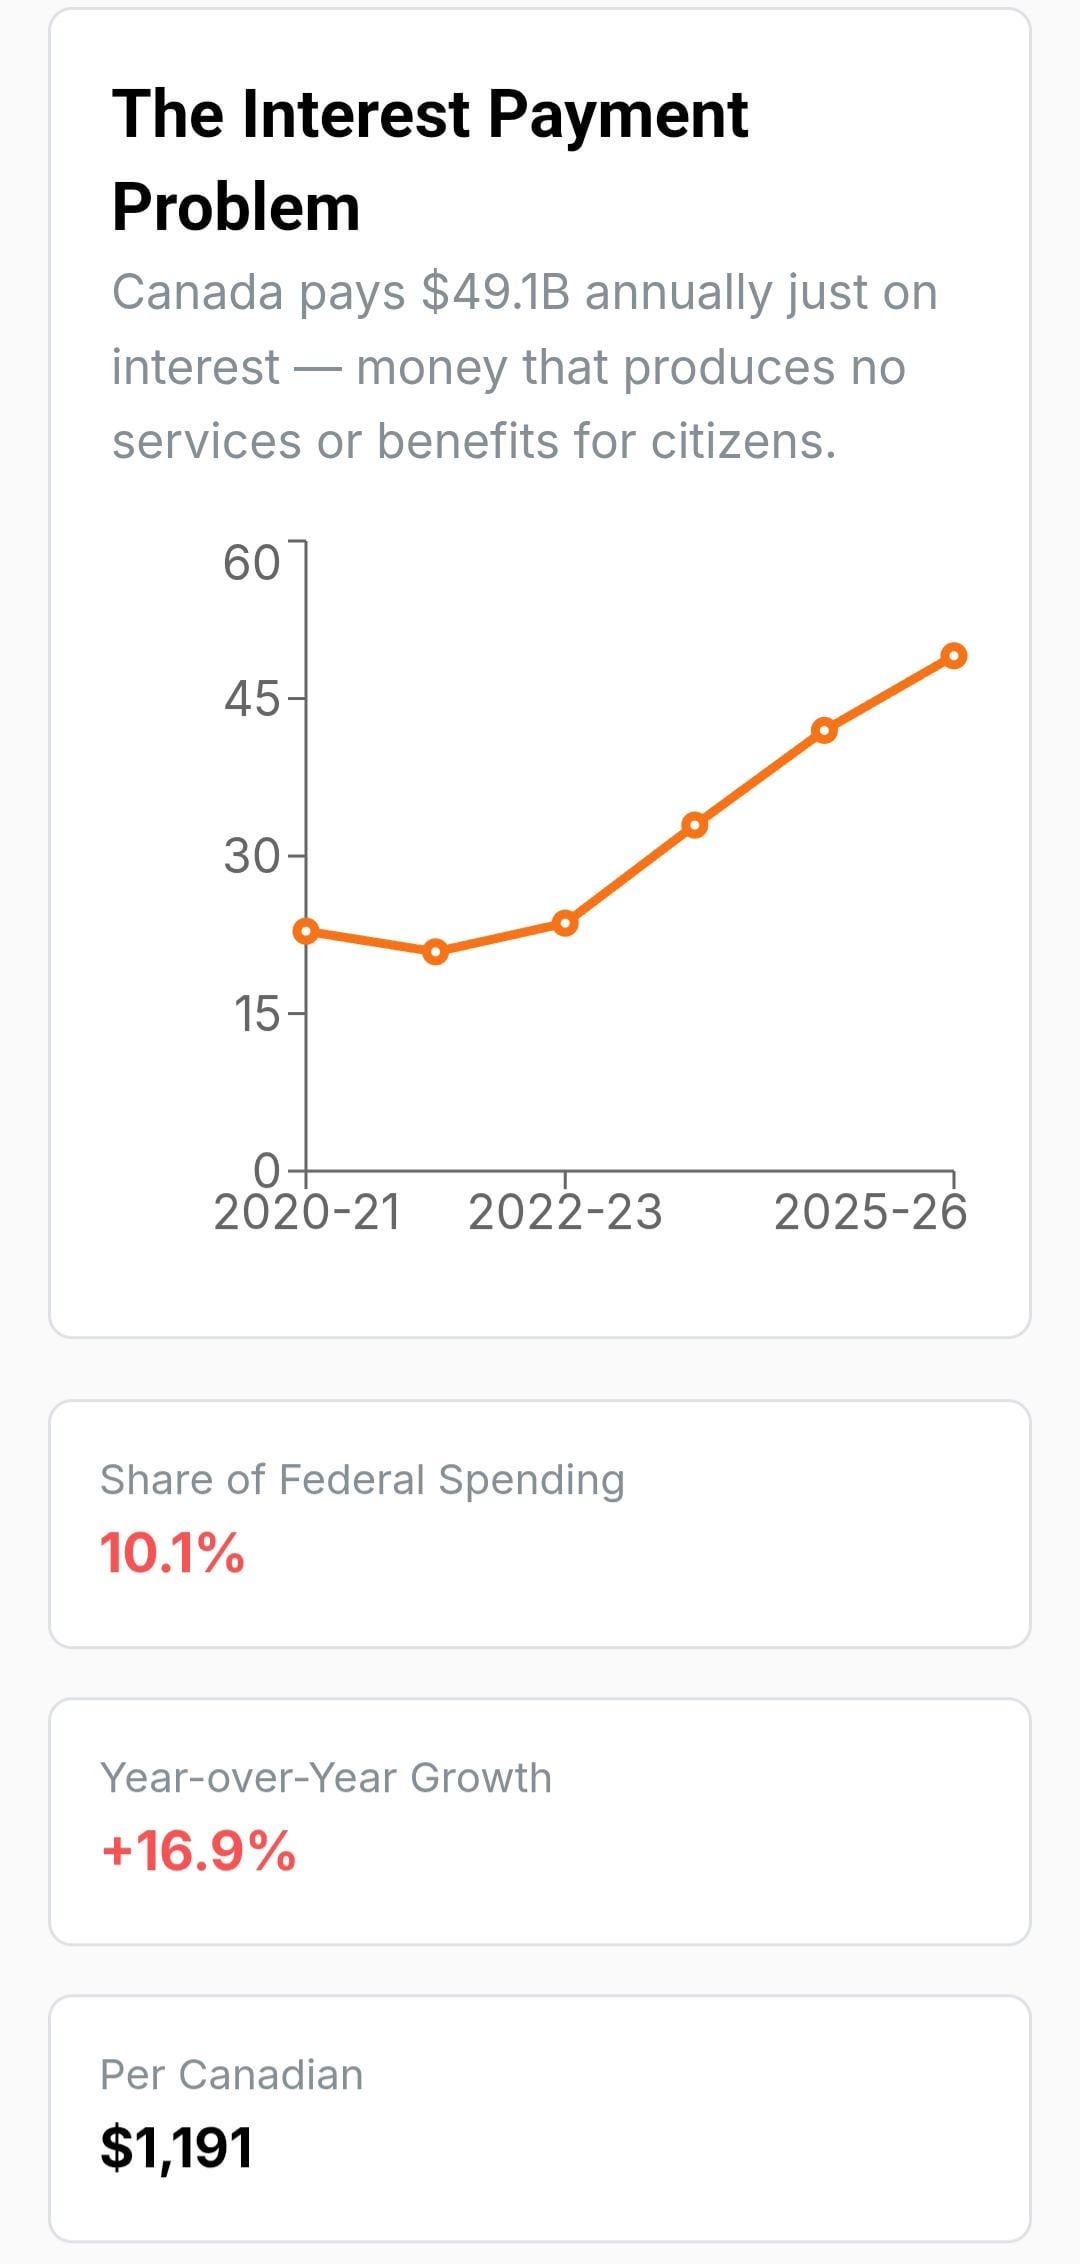
![[OC] Canadians Spend 10% of their budget paying off interest. Canadians spend more on interest than national defense](https://www.europesays.com/wp-content/uploads/2025/09/r3p81h234apf1-1080x1024.jpeg)
I hope mobile sized graphs are OK 🙏
The source is from an interactive Federal budget estimates analysis tool that I recently built. All of the data comes from government estimates
Source of chart/data: https://myparliament.ca/budget
Im sorry to non-canadians who are unable to access the website, currently Im being ddos by bots so IPs not originating from Canada are blocked. (Vpn will work)
Posted by myparliamentCA
12 comments
Source: https://myparliament.ca/budget
Tool: https://myparliament.ca/budget
Canadians hate debt.
Fuck you fmr PM Brian Mulroney
It’s kind of reductive to say that the interest payments “produce no services or benefits to canadian citizens” because the loans that interest attaches to have been spent/invested in a way that produces services and/or benefits and the interest is part of that.
It doesn’t directly pay for them of course but you wouldn’t have them without those debts and interest payments either.
Looks like this started growing after the pandemic so how much of that debt went to supporting Canadian citizens through the pandemic? Genuine question as I’m from the UK and don’t know – if the company we worked for was shut down, we got 80% of our wages paid (up to a limit I can’t remember but was above median wage) and that cost a lot, and produced a lot of debt and interest payments, but we’d be worse off without it.
You might also have direct investments which are paying back more money than the interest rates – like if you borrowed money to build social housing which gets rented at a profit that more than covers the interest payments related to it.
In terms of the data itself, it’s more usual to look at debt:GDP ratio rather than the nominal amount of debt/interest but perhaps in this case comparing the % of federal spending over time would be a better way to examine this data. Big problem with nominal figures is that it doesn’t take into account inflation or economic growth.
Is their debt growing or shrinking?
It should be shown as interest/revenue or interest/GDP (or both, or one or the other + revenue/GDP). Nominal dollars are practically useless for making year-to-year comparisons.
Interest rates would be good to highlight as well. A large portion of the current debt is from COVID (we had a nearly 15% GDP deficit). But debt charges went from 0.9% GDP in 2020-2021, to just 1.0% in 2021-2022. As of 2023-2024 it was 1.6%. That increase wasn’t only due to a debt increase but also an interest rate increase
Finally it would be better to have a longer timeframe. You’re cutting the graph to just a couple years for an inflammatory effect. For example going back to 2011-2012 we had 1.6%GDP in debt charges, same as last year. Going back to 1990 it was **6.5%GDP** in debt charges.
Context is important
Would make sense to had the % of GDP, since the absolute amount in itself is not that relevant.
The editorialising is awkwardly too.
Of course interests don’t produce services or benefits, they are the price of the debt that does fund those
Canadians expect a European-style social program but with US taxation levels.
Eventually something’s got to give, and as usual its probably not going to be the upper classes.
Do you want to print money via interest or via UBI?
National debt turns into private wealth- so it provides value to some of us.
The United States Government is projected to spend US$1.1 trillion on debt interest payments this year, some US$250 billion more than their defence budget. Or in more meaningful terms, while Canada spends 1.61% of GDP on debt servicing costs, the United States spends roughly 2.8% of GDP on debt servicing costs.
Additionally assuming the imminent fall budget adheres to Prime Minster Carney’s post-election announcement that Canada would meet the NATO 2% spending commitment in FY25, this means that this post will be inaccurate in very short time.
That said, even if numerically accurate as of today, it is not beautiful data as it’s unclear if it uses C$ or US$, thought I presumed in my math that it was C$, and it provides no GDP contextualization as I’ve provided in this comment which is far more important than raw numbers in the context of national budgets.
You can thank our formal prime minister who is the definition of nepotism for that one. Do yourself a favour and look at our debt level throughout his tenure and he was famously quoted that the budget will balance itself once….
He also turned a lot of Canadians to have anti immigration stance
Canada like other countries in the G7 have very high debt/GDP ratios. Sad but true – your previous administrations have spent a lot of money – it would be interesting to see what the money was spent on.
Comments are closed.