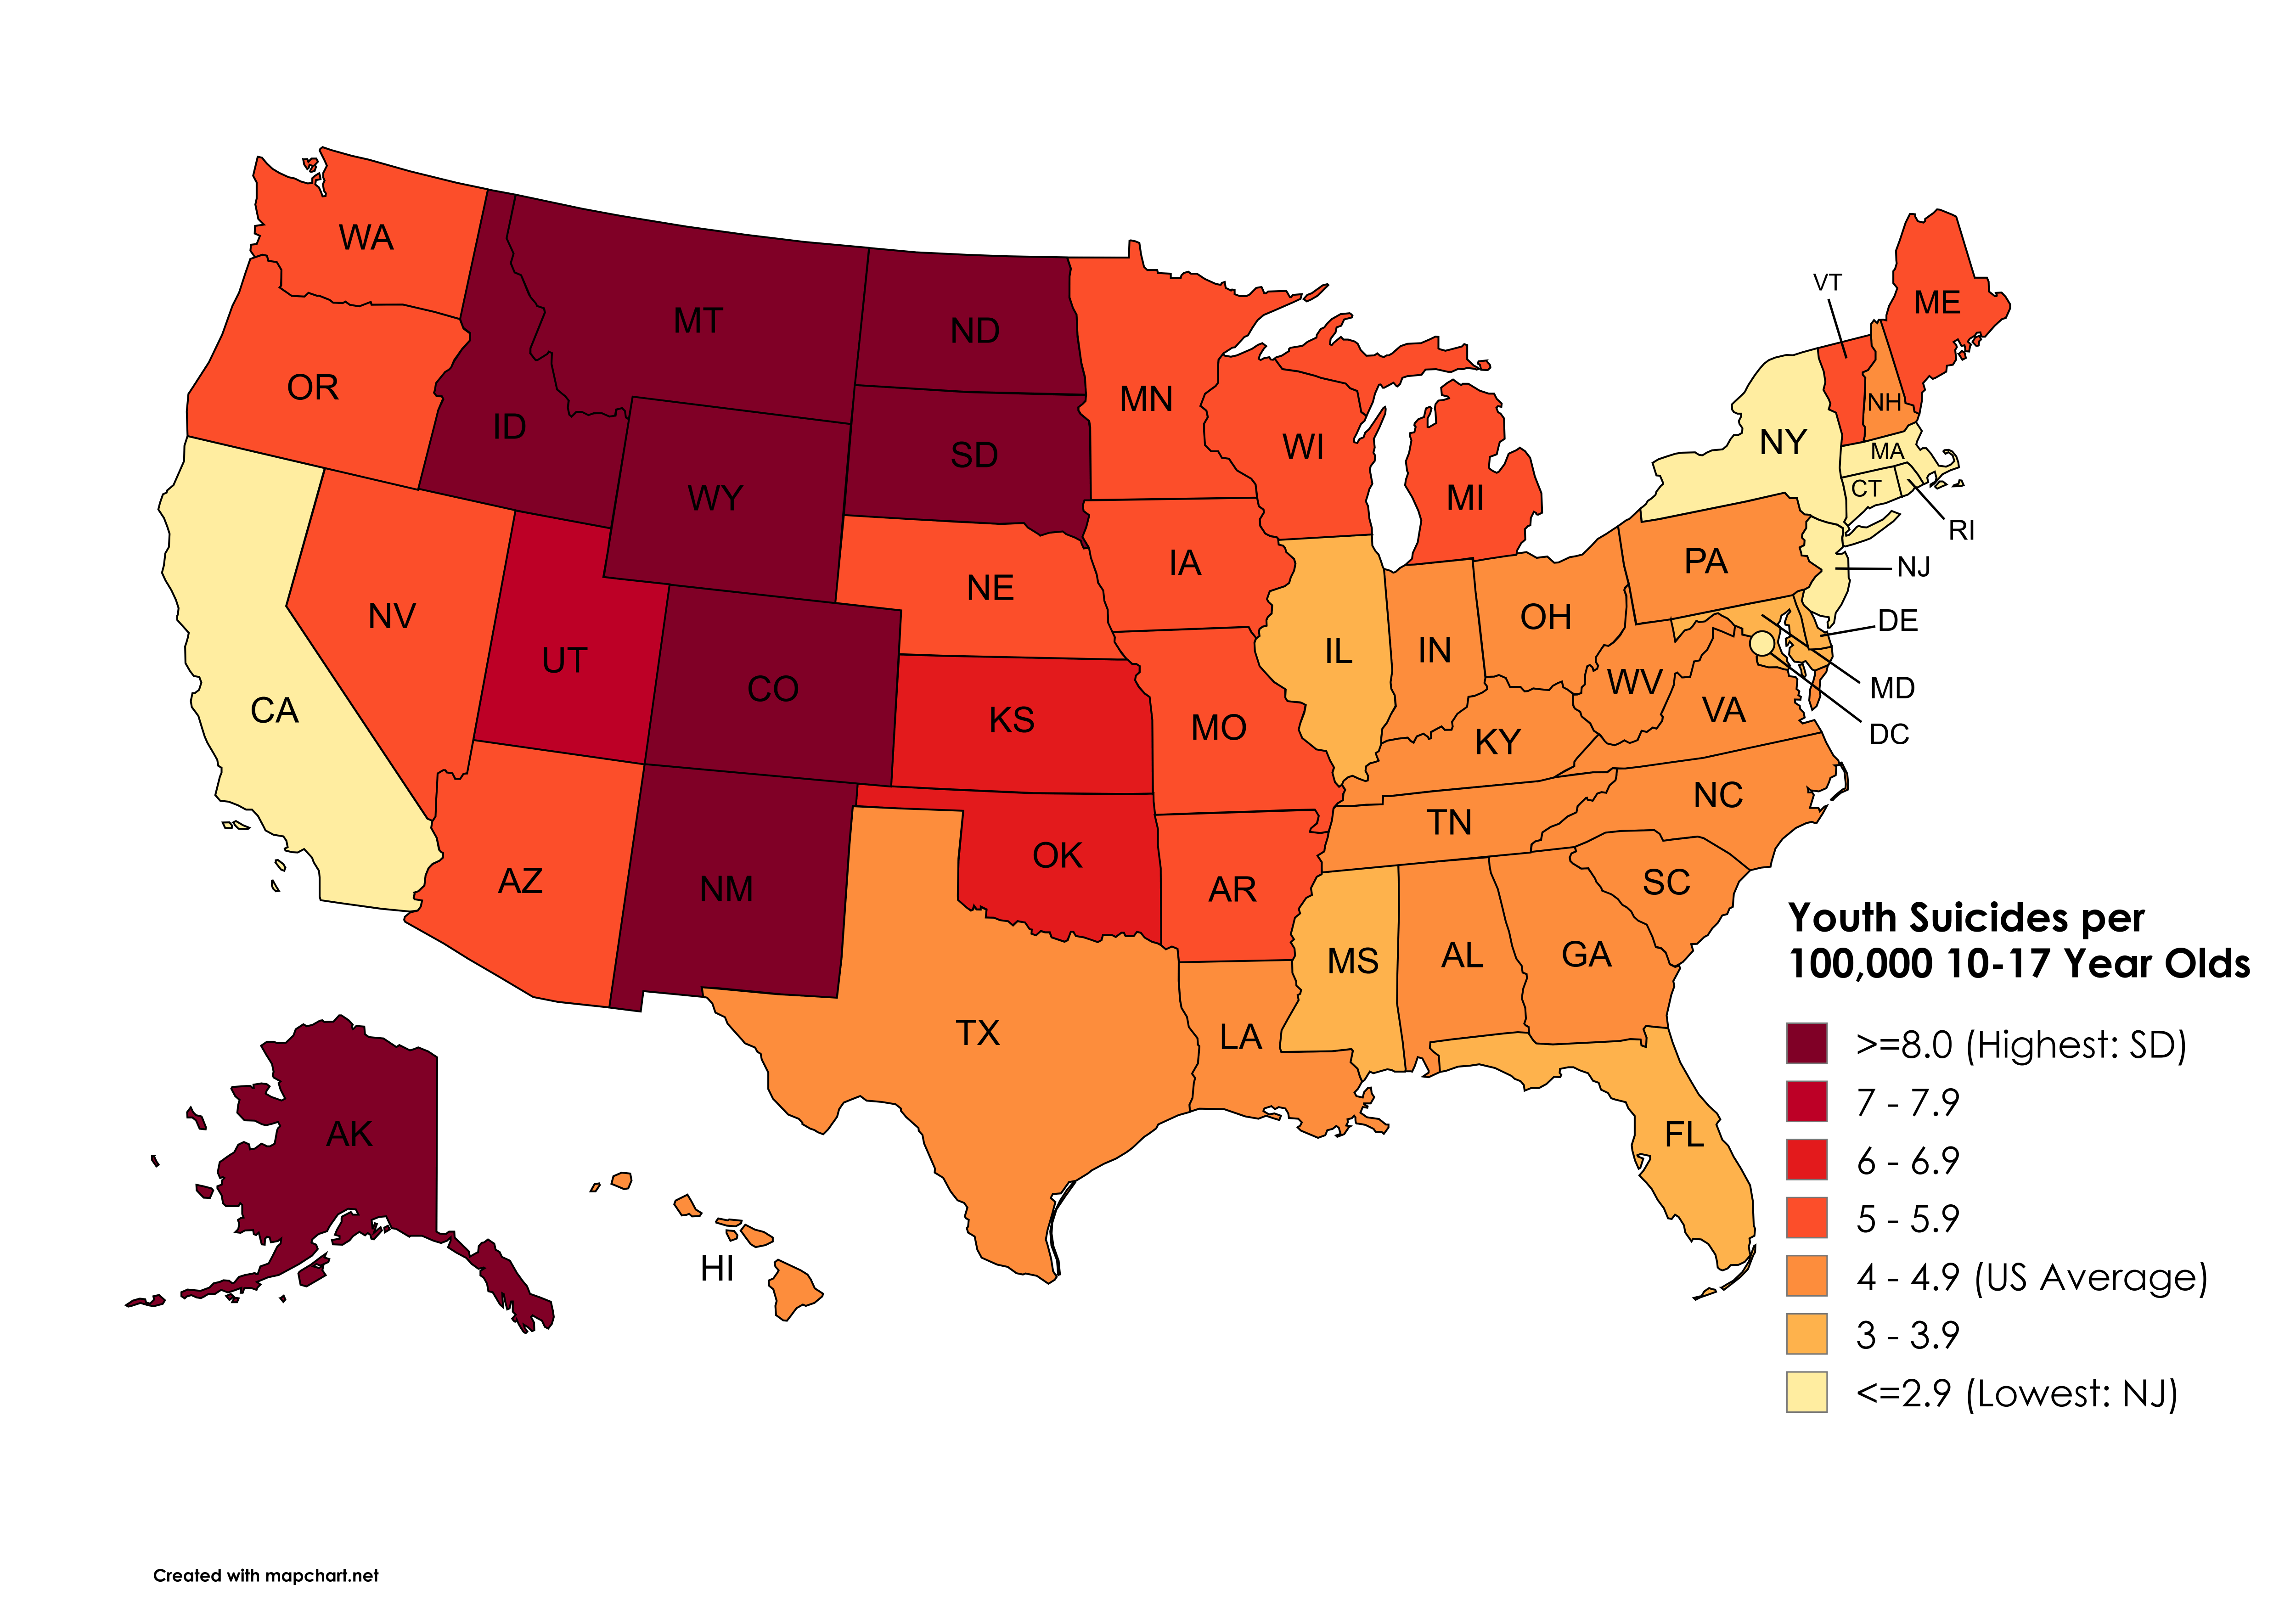
![[OC] Annual Youth Suicides per 100,000 10-17 Year Old's by US State (2009-2023)](https://www.europesays.com/wp-content/uploads/2025/09/4ucrc22x3tqf1-1920x1024.png)
DATA: Data Source: Office of Statistics and Programming, National Center for Injury Prevention and Control, CDC. WISQARS
(Web-Based Injury Statistics Query and Reporting System) [Retrieved April 17, 2025]. Online. Available:
h;ps://wisqars.cdc.gov/
TOOL: Mapchart https://www.mapchart.net/usa.html
Posted by snakkerdudaniel
11 comments
DATA: Data Source: Office of Statistics and Programming, National Center for Injury Prevention and Control, CDC. WISQARS
(Web-Based Injury Statistics Query and Reporting System) [Retrieved April 17, 2025]. Online. Available:
h;ps://wisqars.cdc.gov/
TOOL: Mapchart [https://www.mapchart.net/usa.html](https://www.mapchart.net/usa.html)
Damn, what’s going on around the Rocky Mountains?
Notice the strong correlation between suicide and gun ownership.
first map I’ve ever seen where mississippi isn’t the worst
The continental divide out here causing suicides
Gun ownership, conservatism, the other map talking about bullying was pretty similar, I think while theyre all coorelative it points towards a similarity of culture/society.
I wonder what the map would look like if people living on reservations were counted separately.
Striking resemblance to bullying rate in earlier post
Is it related to elevation?
Maybe it’s the long cold winters.
Those are supposedly some of the happiest states according to the data graphically presented here:
https://www.reddit.com/r/dataisbeautiful/s/VhB3RzmZwH
Comments are closed.