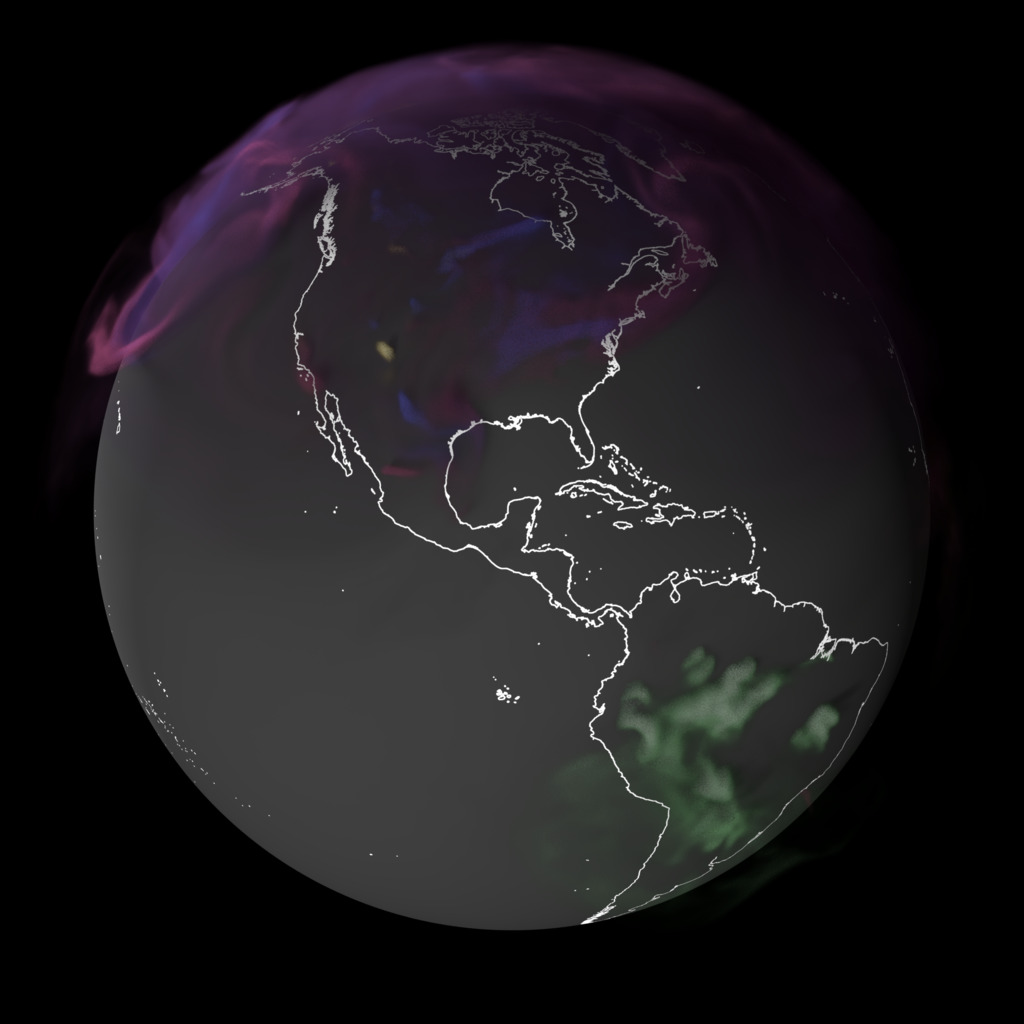
This data visualization shows the different sources of methane (CH₄) in the Earth’s atmosphere over the course of the year 2021. This view highlights Europe, Middle East and Africa. The colors represent contributions from different sources: agriculture and waste (fuchsia), industry (blue), wetlands (green), wildfires and cropland fires (yellow), and other natural sources (gray).