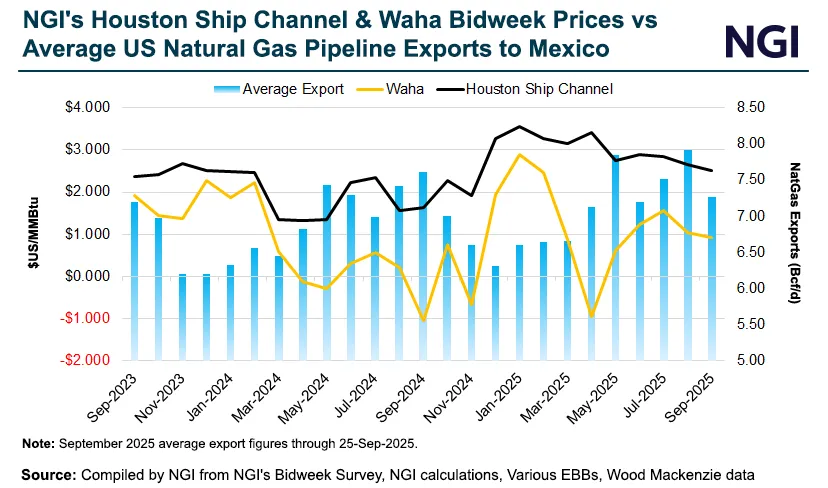
Mexico’s imports of U.S. natural gas have dipped so far in September after a record-setting summer of cross-border flows.

Chart showing NGI’s Houston Ship Channel and Waha natural gas bidweek prices compared with average U.S. pipeline exports to Mexico from September 2023 through September 2025. The line graph tracks Waha and Houston Ship Channel price movements in $/MMBtu, while blue bars represent U.S. natural gas exports to Mexico in Bcf/d. Data illustrates price volatility at Waha, steadier Houston Ship Channel pricing, and relatively stable exports to Mexico around 7–8 Bcf/d. Source: NGI Bidweek Survey, NGI calculations, Wood Mackenzie data.

Expand

At A Glance:

Mexico imports rebound after pipeline curbsWaha trades negative on outages, constraintsCFE pushes new supply options