![[OC] MS Estonia shipwreck datavisualization happening 31 years ago](https://www.europesays.com/wp-content/uploads/2025/09/dtpvc9aqnurf1-1920x1024.jpeg)
I'm proud to share this data visualization
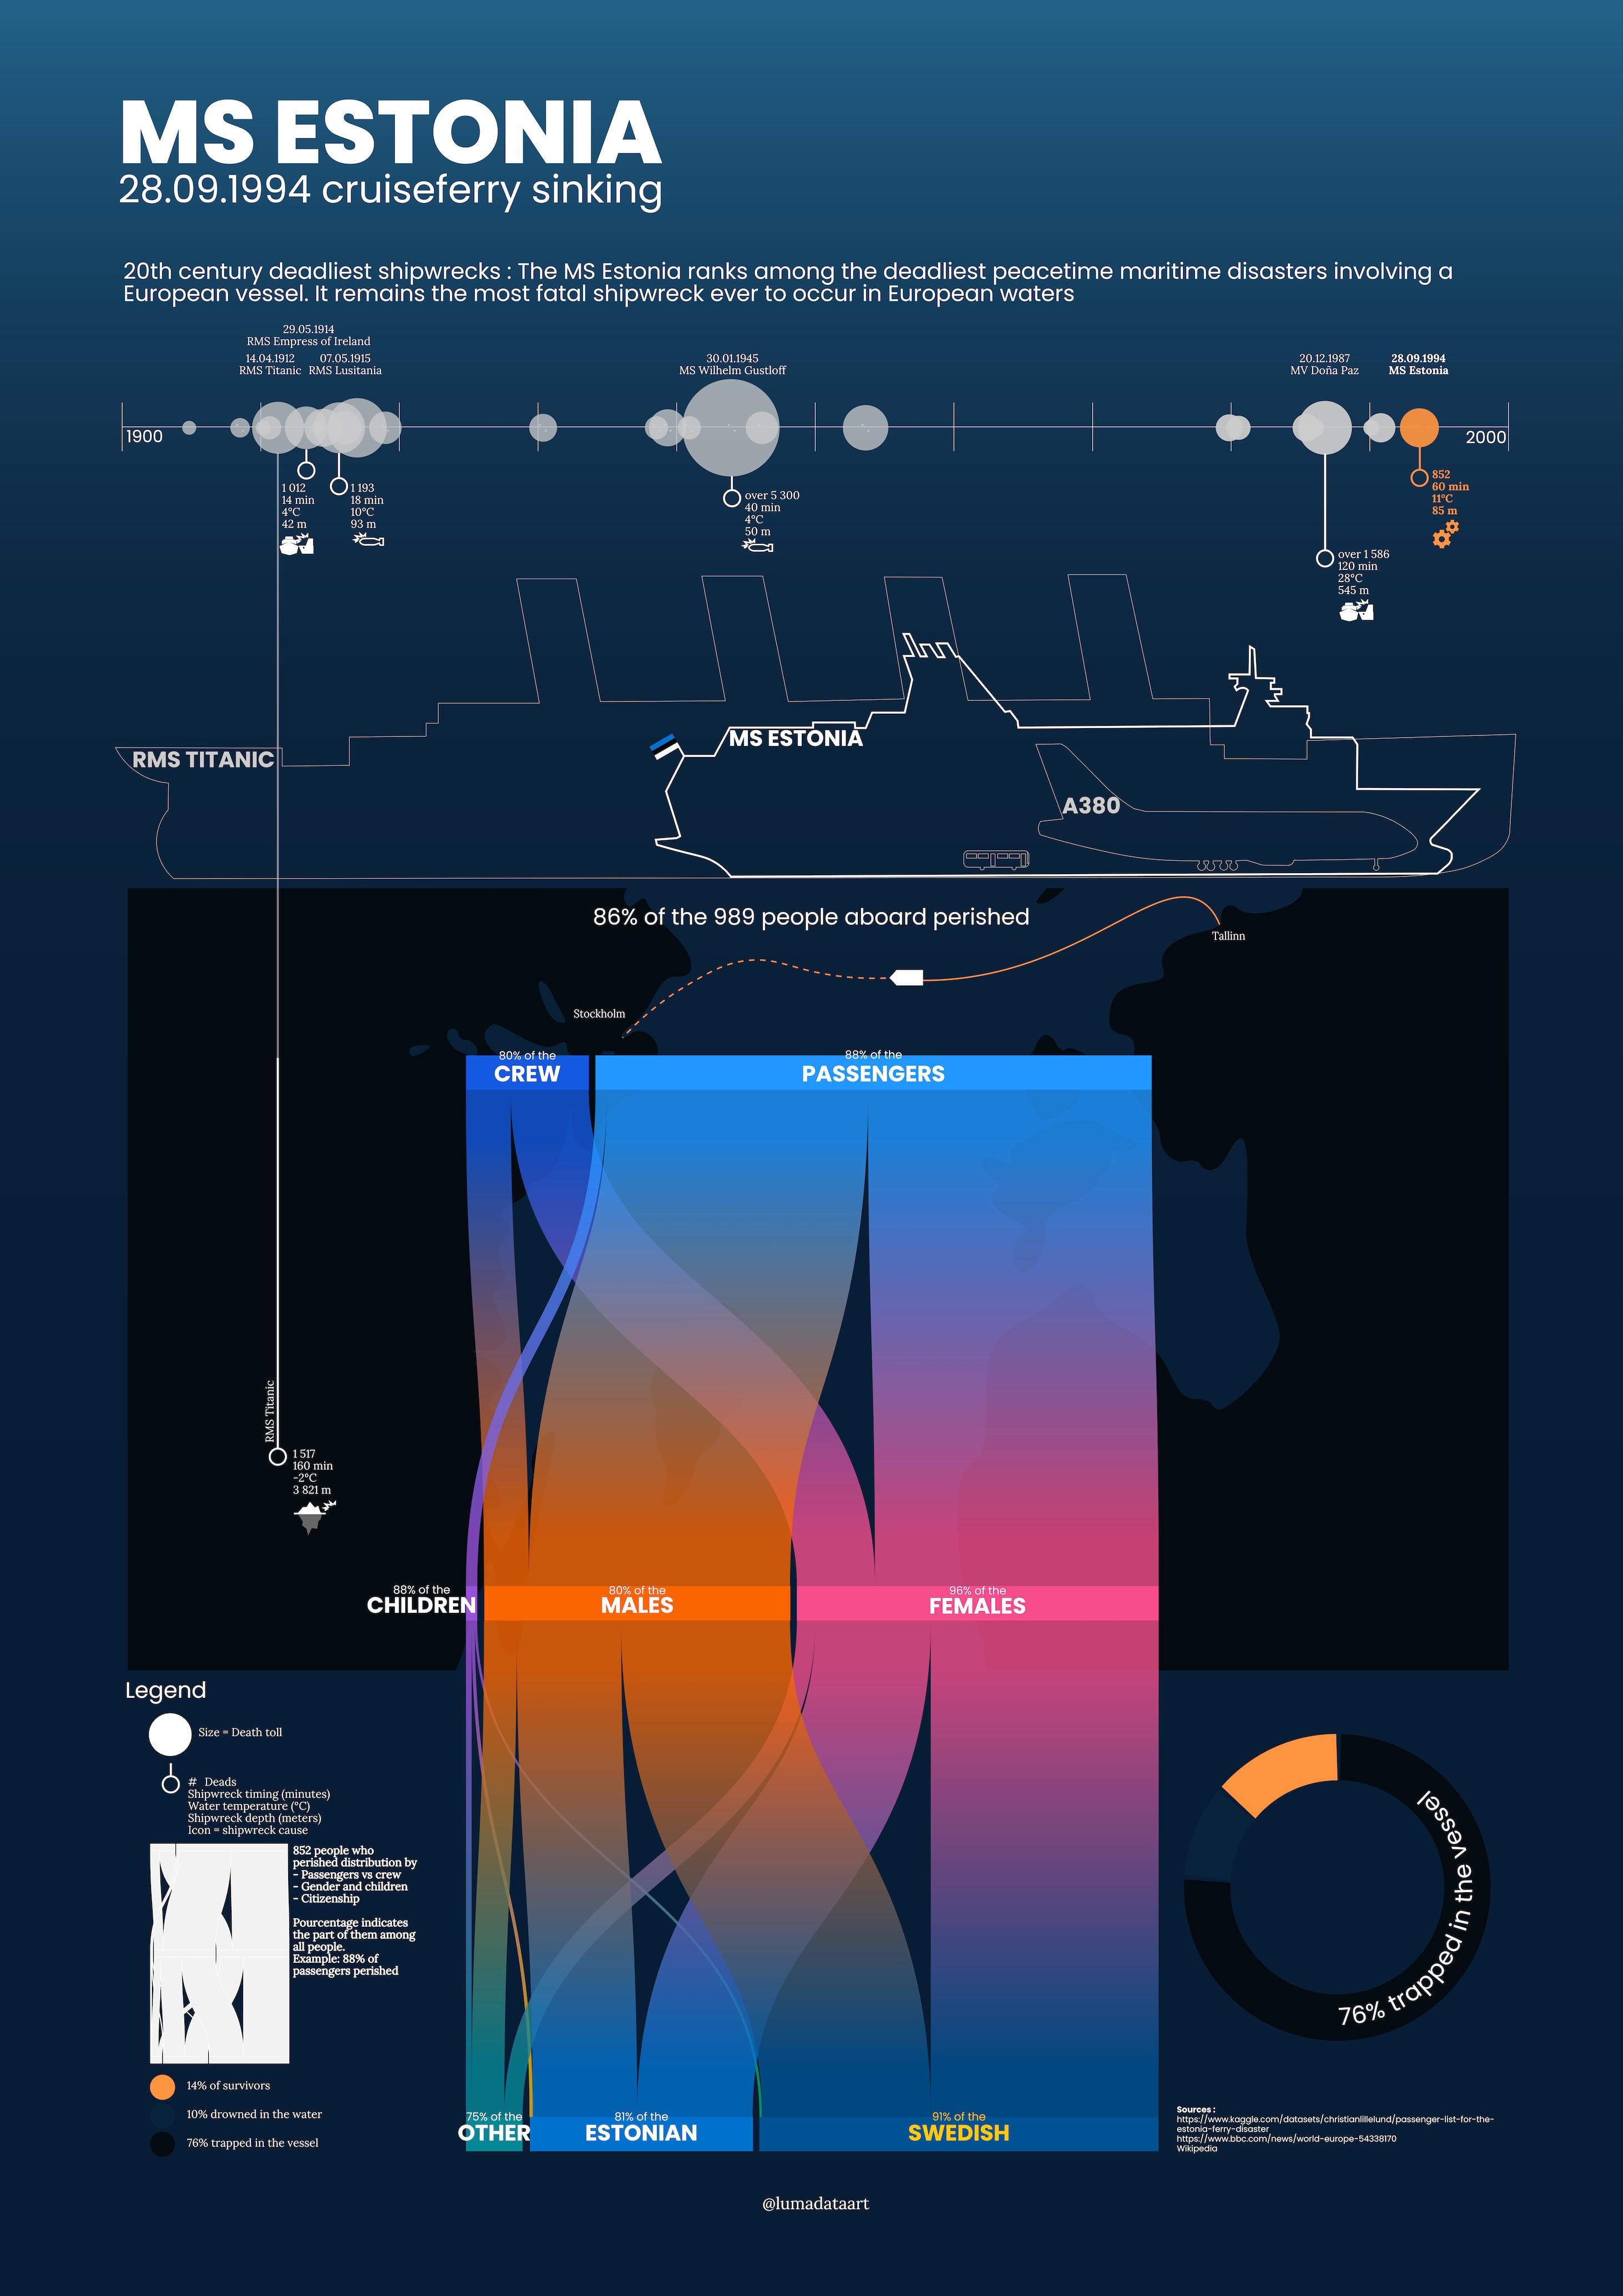
To create this data art visualization, I worked from the Kaggle dataset of passengers and cross-referenced it with other major shipwrecks — including the Titanic — to benchmark and understand patterns. It’s mentally challenging to dive into numbers and testimonies: passenger counts, human losses, sinking times, water temperatures, wreck depths…
Tools: web research, Python for analysis, Illustrator for visualization.
Source : Kaggle passenger dataset
This project combines history, human stories, and data art to visualize a tragedy that should not be forgotten.
Explore the full visualization and story here, on my website: https://lumadataart.com/ms-estonia-shipwreck-datavisualized
Posted by arn0fr
1 comment
The latest documentary showed it as clear as day light that it was an counter offensive from russian aimed at the collaboration between sweden and uk. Since soviet weapon systems got transported on that very same ship.
Comments are closed.