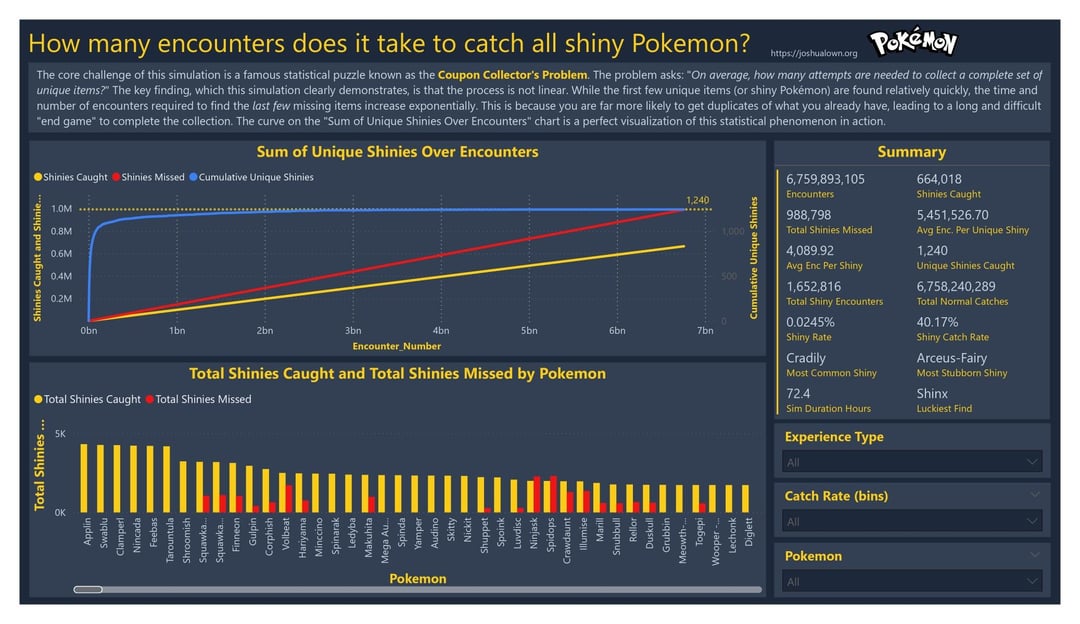
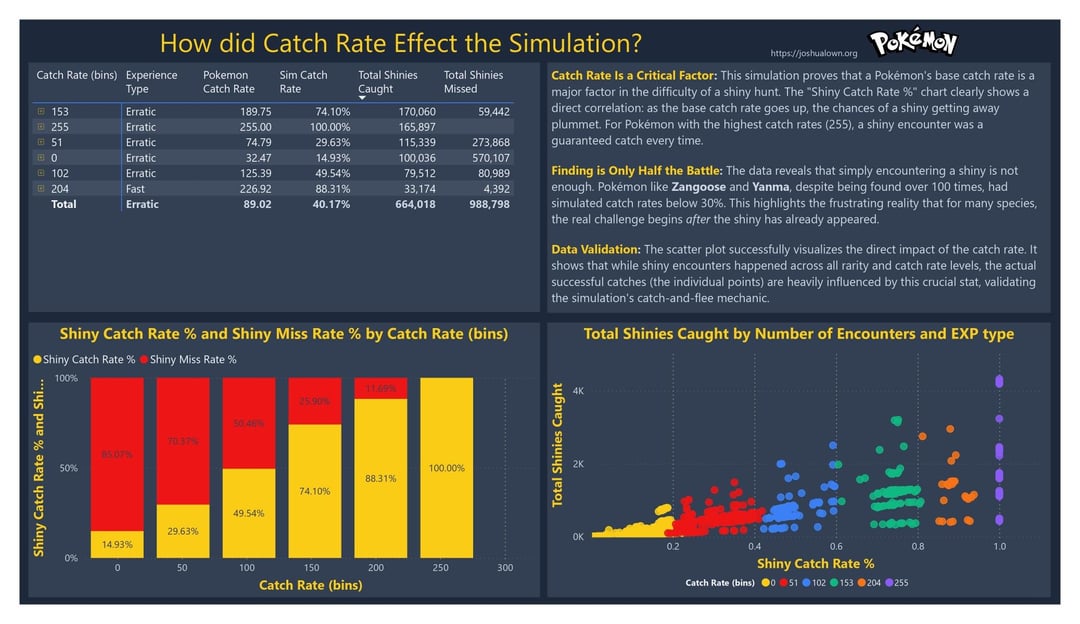
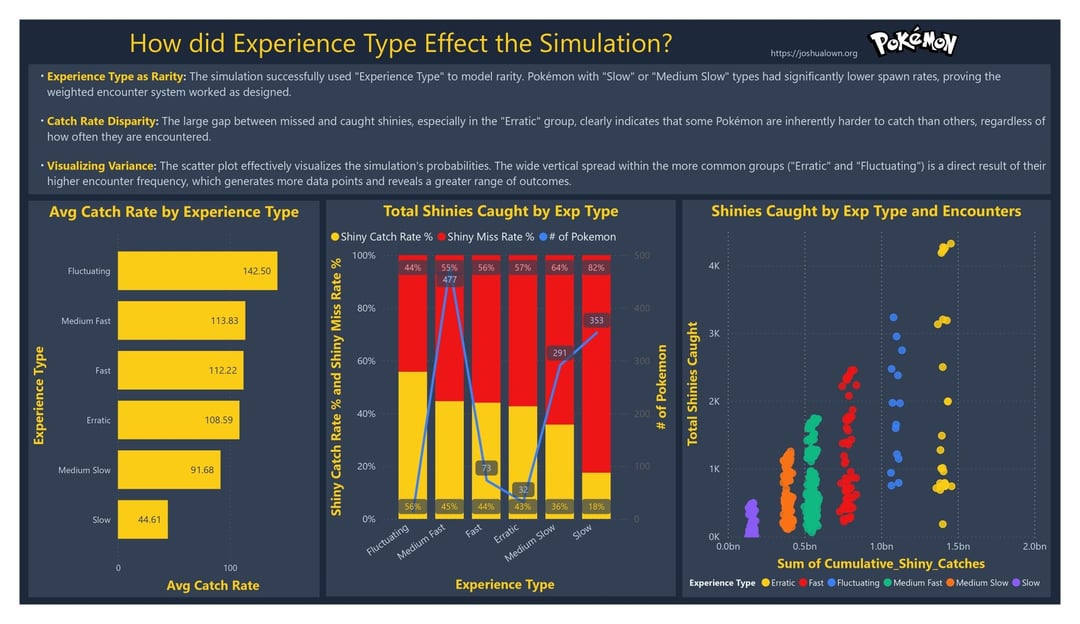
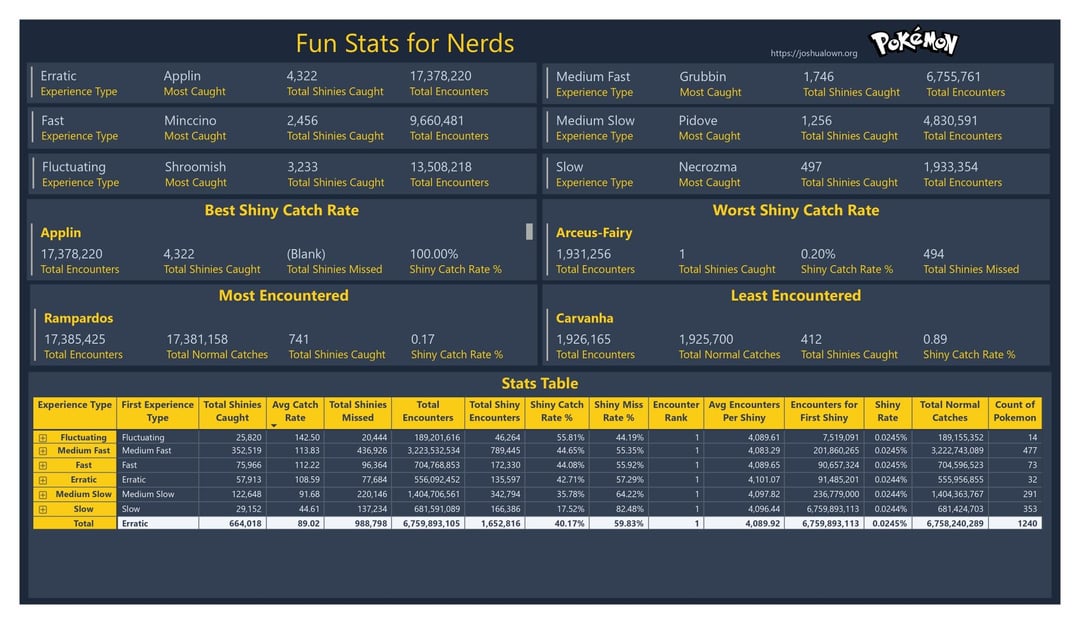
I'm newer to data analytics and this was a project to work on some python, api handling, power bi, and general data analytics. This is my first real project, and would love any feedback to help me grow! The full read can be found on: https://joshualown.org/2025/10/05/i-simulated-6-7-billion-pokemon-encounters-to-quantify-your-suffering/
Posted by rela82me
7 comments
Data source: self-generated python simulations (Github: [https://github.com/rela82me/shiny-encounter-simulation](https://github.com/rela82me/shiny-encounter-simulation) )
(read more here: [https://joshualown.org/2025/10/05/i-simulated-6-7-billion-pokemon-encounters-to-quantify-your-suffering/](https://joshualown.org/2025/10/05/i-simulated-6-7-billion-pokemon-encounters-to-quantify-your-suffering/) )
Tools used: Python, VS Code, Power BI, Poke API
This is so cool. Love the visuals.
Great article! A grind I’ll never do haha.
I wonder how this lines up with the living shiny pokedex challenge that Johnstone has been doing
Finally some content that lives up to the name of the sub
Slick, makes sense. That first plot would work nicer in log scale I’d think
Ahhh, some real honest-to-god data viz! Thanks, this is fascinating stuff. Pokémon has always been great for us data nerds.
Comments are closed.