
NIKE is a name that stands out in any conversation about long-term investing or portfolio growth. If you have been watching the swoosh lately, you are probably wondering if now is the time to put faith in a turnaround, or if the recent dip signals a rougher road ahead. Over the last year, the stock’s rollercoaster ride has likely tested the patience of even loyal shareholders. In the past week alone, shares have slipped 9.3%, bringing the 30-day loss to 12.2%. If we zoom out further, NIKE is down an eye-opening 45.5% over five years. This serves as a reminder that even industry leaders are not immune to broad market shifts and changing investor sentiment.
Some of this downward momentum has tracked alongside high-profile shifts in global consumer demand and continued turbulence in the retail sector. As competitors adapt quickly to digital-first strategies and supply chain innovation, investors are scrutinizing whether NIKE’s brand power can spark a rebound.
So what does that mean for you, the shareholder or the would-be buyer? When we look strictly at classic valuation metrics, NIKE scores a 1 out of 6. This indicates that it only meets one of the six major criteria for being undervalued. On the surface, that might sound like a red flag, but the full picture is more nuanced than any single number can reveal. Next, we will dive into how different valuation tools assess NIKE today, and hint at an even sharper way to look at value before you make your next move.
NIKE scores just 1/6 on our valuation checks. See what other red flags we found in the full valuation breakdown.
Approach 1: NIKE Discounted Cash Flow (DCF) Analysis
The Discounted Cash Flow (DCF) model projects a company’s future cash flows and discounts them back to today, estimating the business’s intrinsic value based on its ability to generate cash over time. For NIKE, this approach starts by evaluating the company’s Free Cash Flow, which over the last twelve months reached $2.85 billion. Analysts forecast that NIKE’s annual cash flows will increase substantially in the years ahead, with projections reaching nearly $5.89 billion by 2030. Estimates beyond five years are extrapolations rather than direct forecasts.
This two-stage DCF calculation takes both short-term analyst estimates and longer-term extrapolations into account, giving a comprehensive view of what NIKE could deliver to shareholders. The result is a fair value estimate of $62.44 per share. With the stock currently trading nearly 4.5% above this level, the DCF model signals NIKE may be right around its intrinsic value rather than trading at a bargain or a steep premium.
Result: ABOUT RIGHT
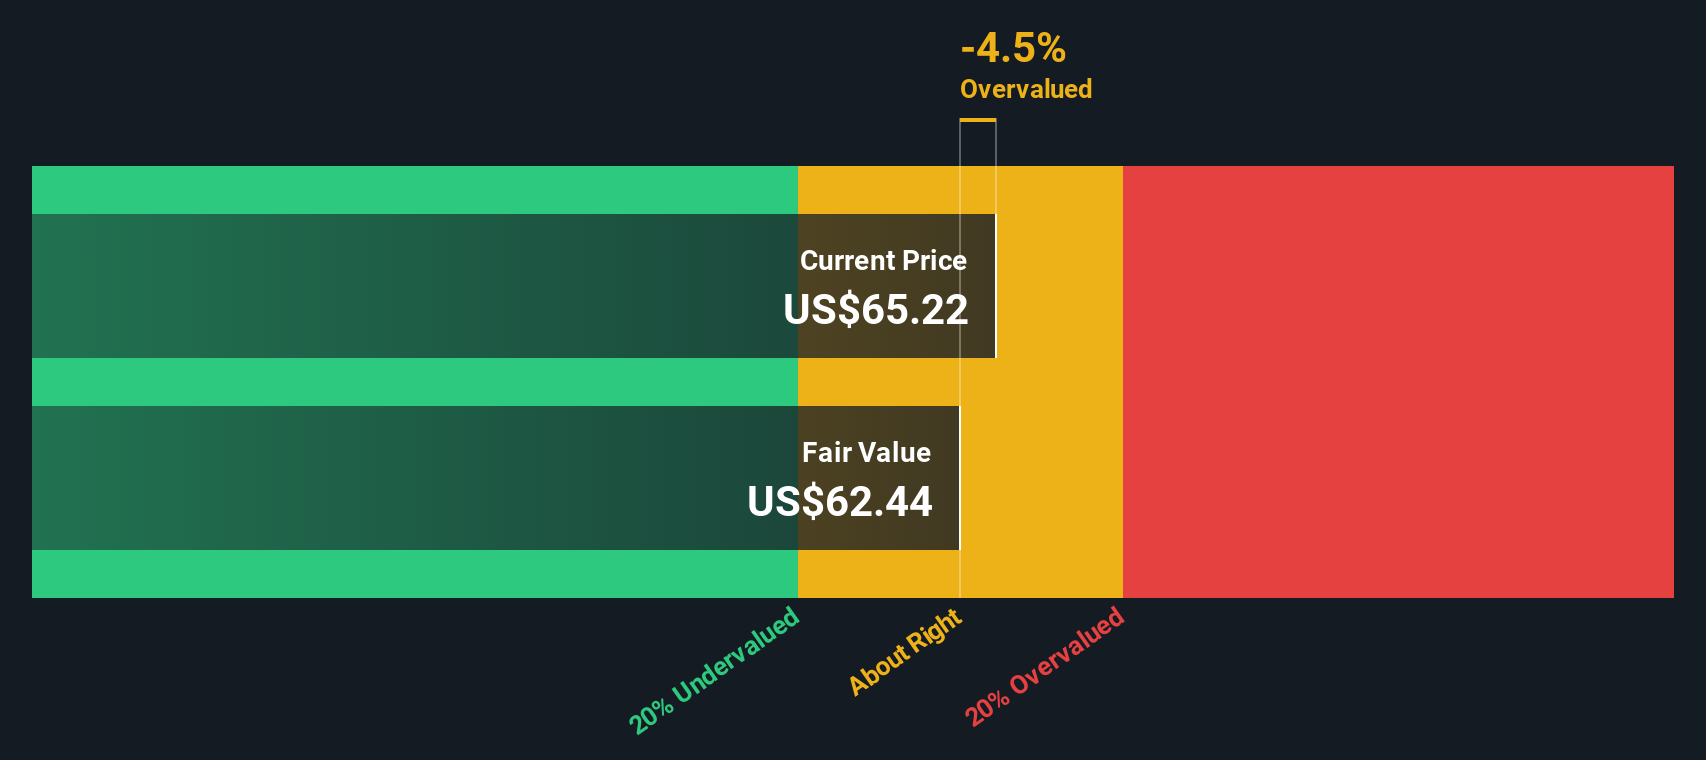 NKE Discounted Cash Flow as at Oct 2025
Simply Wall St performs a valuation analysis on every stock in the world every day (check out NIKE’s valuation analysis). We show the entire calculation in full. You can track the result in your watchlist or portfolio and be alerted when this changes.
Approach 2: NIKE Price vs Earnings
The Price-to-Earnings (PE) ratio is a widely used valuation metric for established, profitable companies, as it reflects what investors are willing to pay today for a dollar of future earnings. Since NIKE generates significant profits, the PE ratio gives a direct measure of market expectations for the company’s future growth and risk profile.
Growth prospects and perceived risks play a big role in shaping what a normal or fair PE ratio should be. Companies anticipated to grow faster or with less risk usually carry a higher PE, while more mature or riskier businesses command lower multiples. NIKE currently trades at a PE ratio of 33.3x, closely in line with the peer average of 33.6x but considerably higher than the broader luxury industry average of 19.8x. This suggests investors see NIKE as a premium brand with strong earnings potential compared to the sector overall.
However, raw industry and peer comparisons do not account for all variables. Simply Wall St’s Fair Ratio steps in here, estimating a PE of 27.3x for NIKE based on a proprietary assessment that blends factors like earnings growth, margins, size, and industry risks. This approach is more insightful than simple averages because it customizes expectations for NIKE’s unique strengths and vulnerabilities.
Comparing NIKE’s actual PE of 33.3x with its Fair Ratio of 27.3x, the difference suggests shares are priced slightly above what would be considered fair based on fundamentals. Given the moderate gap, NIKE’s valuation appears a bit stretched, but not dramatically so.
Result: OVERVALUED
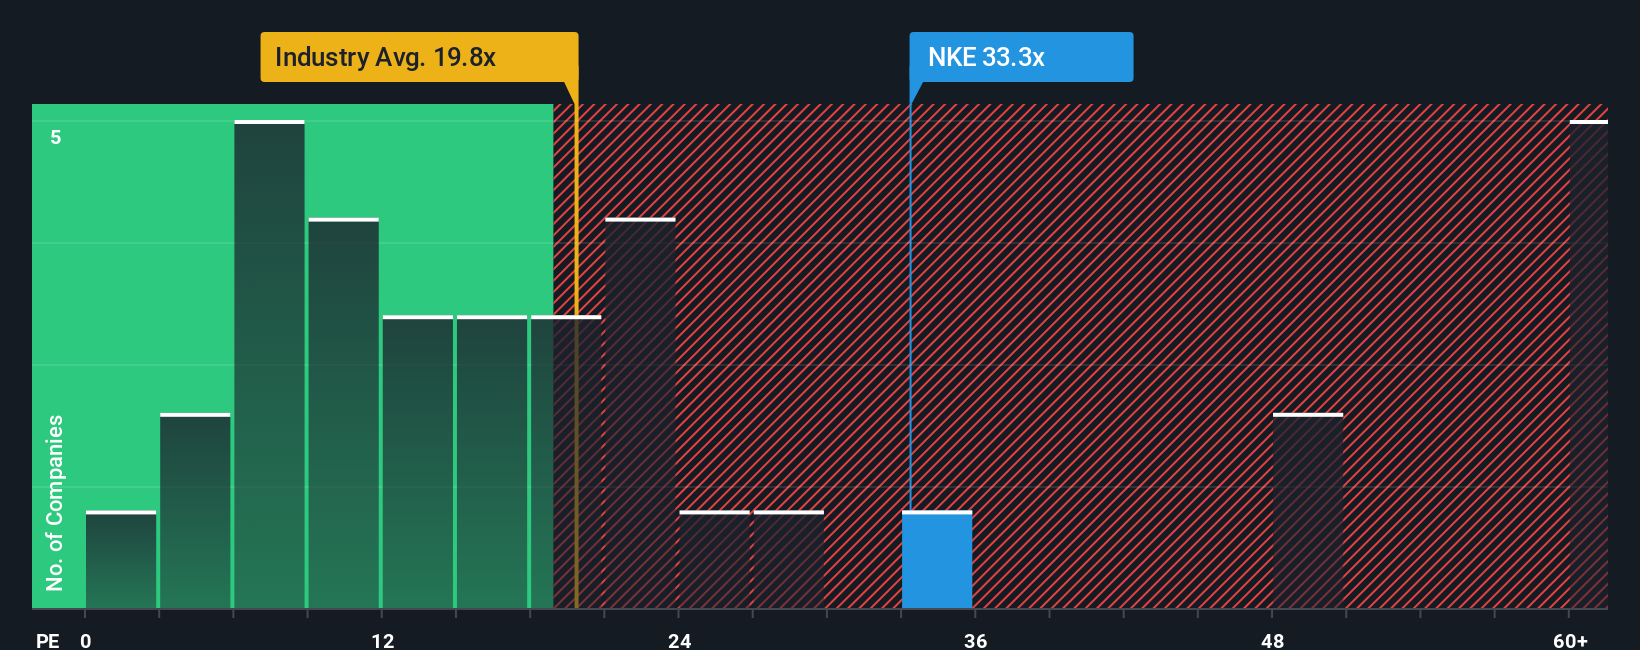 NYSE:NKE PE Ratio as at Oct 2025
PE ratios tell one story, but what if the real opportunity lies elsewhere? Discover companies where insiders are betting big on explosive growth.
Upgrade Your Decision Making: Choose your NIKE Narrative
Earlier we mentioned that there is an even better way to understand valuation, so let’s introduce you to Narratives. A Narrative is simply your story for the company, bringing together your assumptions about future revenue, profit margins, and fair value, all backed by your perspective on NIKE’s business and industry outlook.
Narratives are a powerful tool because they connect the company’s real-world story, like changes in leadership or expansion plans, directly to your financial forecasts and the resulting fair value. Available on Simply Wall St’s Community page, Narratives make it easy for anyone to build, share, and compare their reasoning. No advanced spreadsheets required.
When you use Narratives, you can quickly see how your fair value compares with current market prices and weigh your own buy or sell decisions accordingly. Plus, these stories update dynamically if news breaks or new results are posted, so your Narrative always reflects the latest info.
For example, some investors currently see NIKE’s fair value as high as $120, focusing on a big recovery and long-term innovation, while others set it as low as $38, highlighting ongoing retail risks and global headwinds. Your Narrative could land anywhere in between based on what matters most to you.
Do you think there’s more to the story for NIKE? Create your own Narrative to let the Community know!
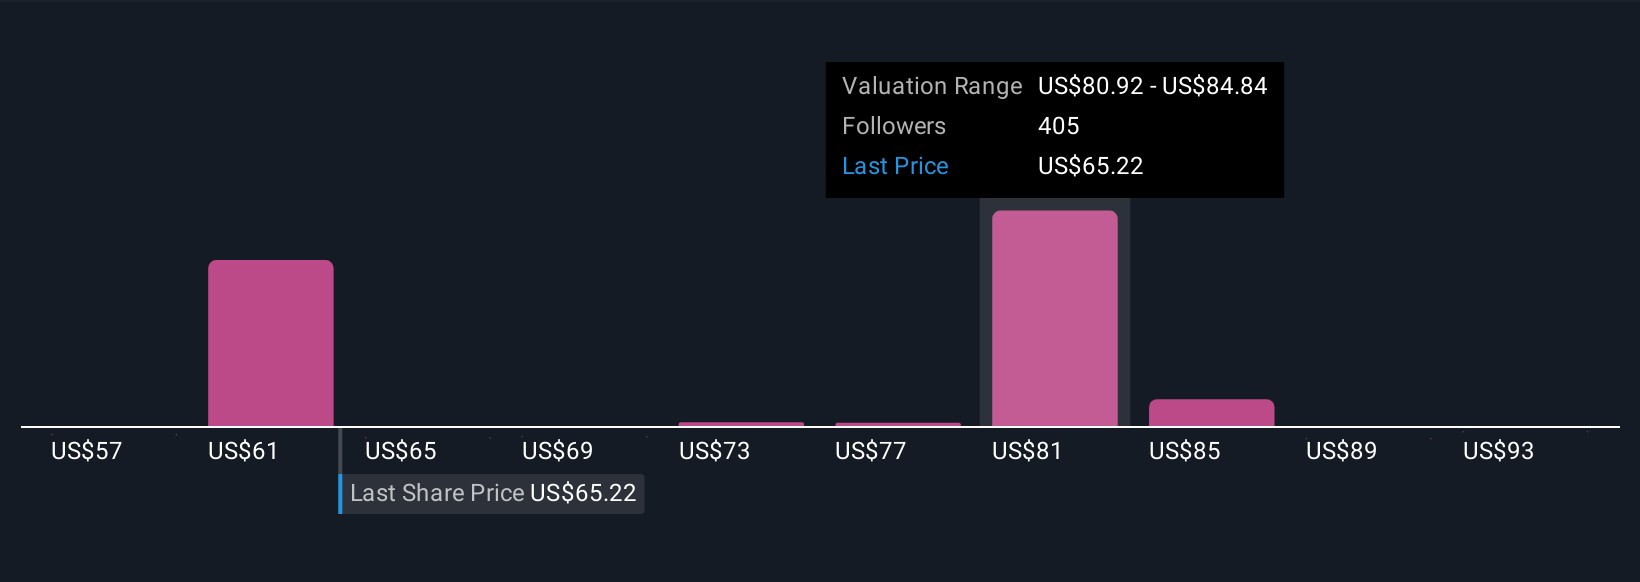 NYSE:NKE Community Fair Values as at Oct 2025
This article by Simply Wall St is general in nature. We provide commentary based on historical data
and analyst forecasts only using an unbiased methodology and our articles are not intended to be financial advice. It does not constitute a recommendation to buy or sell any stock, and does not take account of your objectives, or your
financial situation. We aim to bring you long-term focused analysis driven by fundamental data.
Note that our analysis may not factor in the latest price-sensitive company announcements or qualitative material.
Simply Wall St has no position in any stocks mentioned.
Discover if NIKE might be undervalued or overvalued with our detailed analysis, featuring fair value estimates, potential risks, dividends, insider trades, and its financial condition.
Have feedback on this article? Concerned about the content? Get in touch with us directly. Alternatively, email editorial-team@simplywallst.com