
If you are looking at StoneCo right now, you are probably asking yourself the same question every savvy investor wants answered: is it time to buy, hold, or think twice? There is no shortage of opinions on market darlings and comebacks, but StoneCo stands out after a dramatic ride. Its shares have returned an astonishing 112.8% year-to-date, but that comes on the heels of a five-year plunge of 70.2%. In the shorter term, things have cooled recently, with the stock dipping 4.1% over the past week and sliding 5.7% over the last month. That kind of volatility often signals either a renewed sense of opportunity or a shift in risk perception. With emerging markets seeing changing capital flows and more attention from international investors, it is no wonder StoneCo has been in the spotlight.
Despite the recent pullback, a valuation check shows StoneCo scores a 5 out of 6, meaning by nearly every standard we use, the company looks undervalued. Still, numbers only tell part of the story. Why does the market sometimes miss or misjudge this kind of value? Next, we will walk through the key valuation methods and see what they reveal about StoneCo’s situation. But stay tuned, because we will also dig into a smarter way to get the real picture of the stock’s true worth.
Approach 1: StoneCo Excess Returns Analysis
The Excess Returns Model evaluates a company’s ability to generate profits above the required cost of equity capital, providing a lens on both profitability and capital efficiency. For StoneCo, this means assessing how much value is created for shareholders by comparing returns on invested capital to what it actually costs to access that capital.
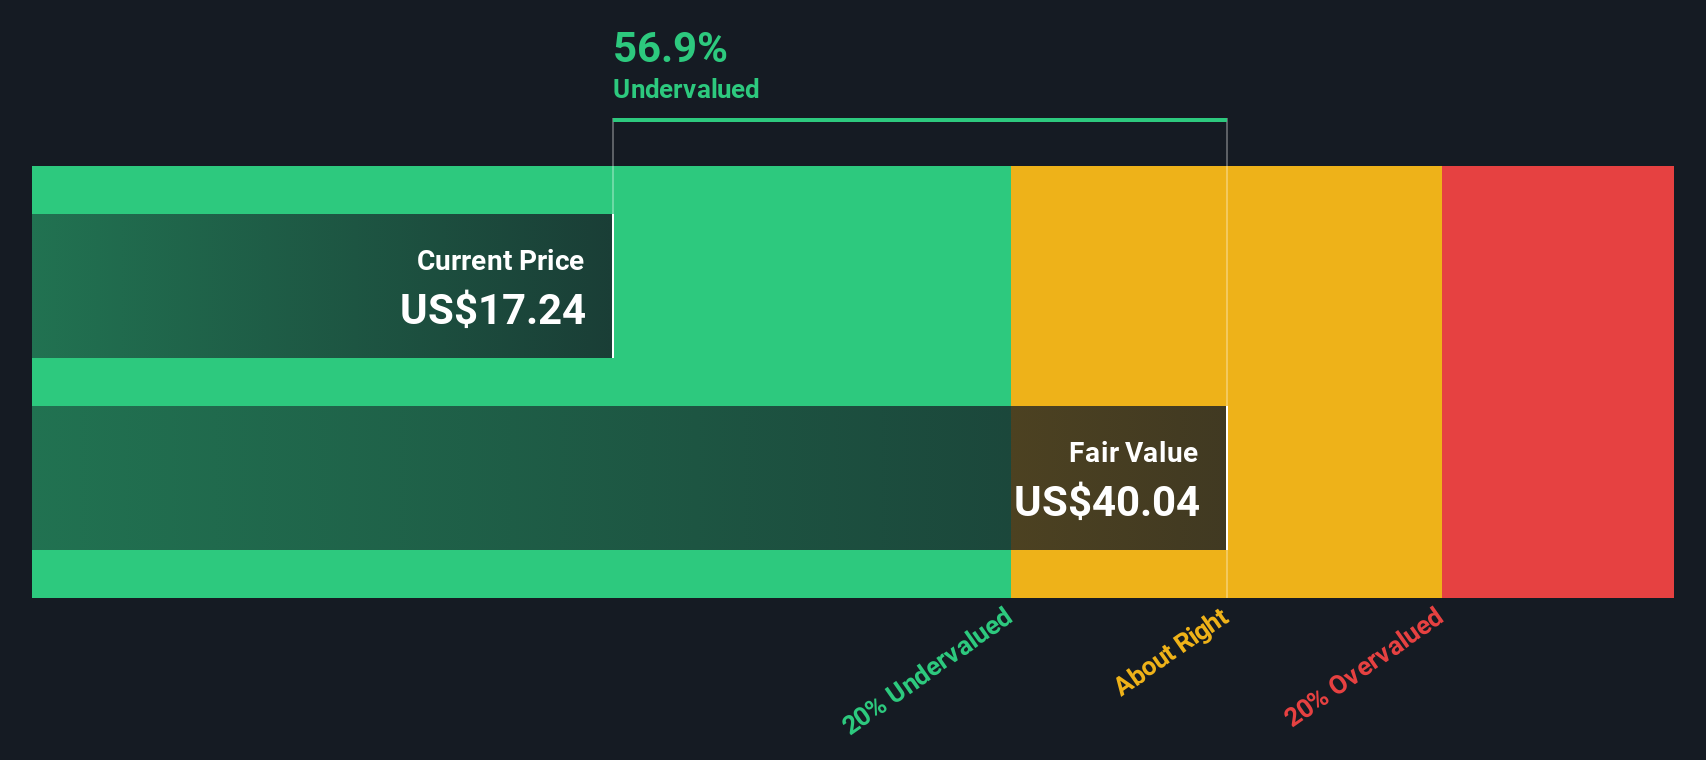
StoneCo posts a robust average Return on Equity of 23.51%, well above its estimated cost of equity at $3.81 per share. Its book value sits at $43.24 per share, with stable future projections suggesting this could rise to $49.56 per share according to six analyst estimates. The company also shows a stable EPS of $11.65 per share, driven by weighted future Return on Equity estimates from 10 analysts. Most critically, after covering the cost of equity, StoneCo’s excess return is $7.85 per share—a compelling sign.
This model implies an intrinsic value that is 56.9% higher than the current share price. In other words, StoneCo appears meaningfully undervalued according to this method, with strong return profiles and favorable growth projections anchoring the appraisal.
Result: UNDERVALUED
 STNE Discounted Cash Flow as at Oct 2025
Our Excess Returns analysis suggests StoneCo is undervalued by 56.9%. Track this in your watchlist or portfolio, or discover more undervalued stocks.
Approach 2: StoneCo Price vs Sales
The Price-to-Sales (PS) ratio is often the preferred multiple for evaluating companies like StoneCo, especially in the rapidly evolving fintech sector. In this space, revenue growth can outpace reported earnings due to transitional expenses or reinvestment strategies. This metric provides a clear view of how the market values every dollar of StoneCo’s sales, making it particularly useful when current profits are less stable or negative and top-line performance is strong.
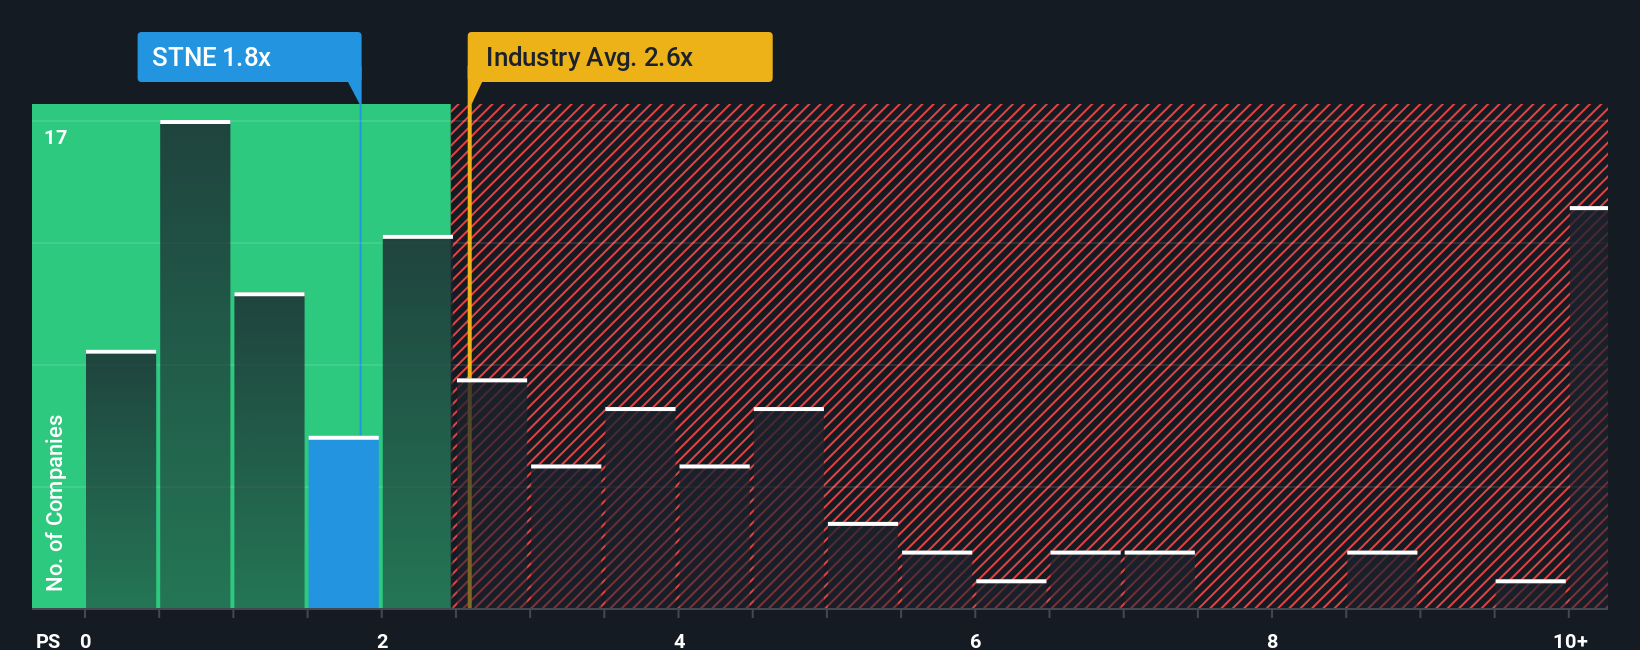
What constitutes a “normal” or “fair” PS ratio hinges on factors such as expected sales growth, profit margins, risk profile, and industry conditions. Higher growth prospects or stronger margins can warrant a higher PS multiple, while increased market risks or thin margins usually pull it lower. For context, StoneCo currently trades on a PS ratio of 1.84x. This sits well below the industry average of 2.57x and the peer average of 2.76x, suggesting a relative discount compared to its competition.
However, Simply Wall St’s “Fair Ratio” offers a more tailored benchmark. By incorporating StoneCo’s growth outlook, risk characteristics, profitability, and its position within the diversified financial industry, the Fair Ratio presents a personalized expectation with a current value of 3.01x. Unlike raw peer or industry averages, it adjusts for what really matters to the business and its forecasts. Comparing StoneCo’s actual PS ratio (1.84x) to its Fair Ratio (3.01x), the stock appears materially undervalued using this approach.
Result: UNDERVALUED
 NasdaqGS:STNE PS Ratio as at Oct 2025
PS ratios tell one story, but what if the real opportunity lies elsewhere? Discover companies where insiders are betting big on explosive growth.
Upgrade Your Decision Making: Choose your StoneCo Narrative
Earlier we mentioned that there is an even better way to understand valuation, so let’s introduce you to Narratives. Narratives are an approach that goes beyond the balance sheet; they let you connect the story you believe about a company, like StoneCo, to your financial forecasts and estimates for fair value. On Simply Wall St’s Community page, millions of investors use Narratives as an easy, accessible tool to lay out their own view of a company’s growth, margins, and future earnings, all in one place.
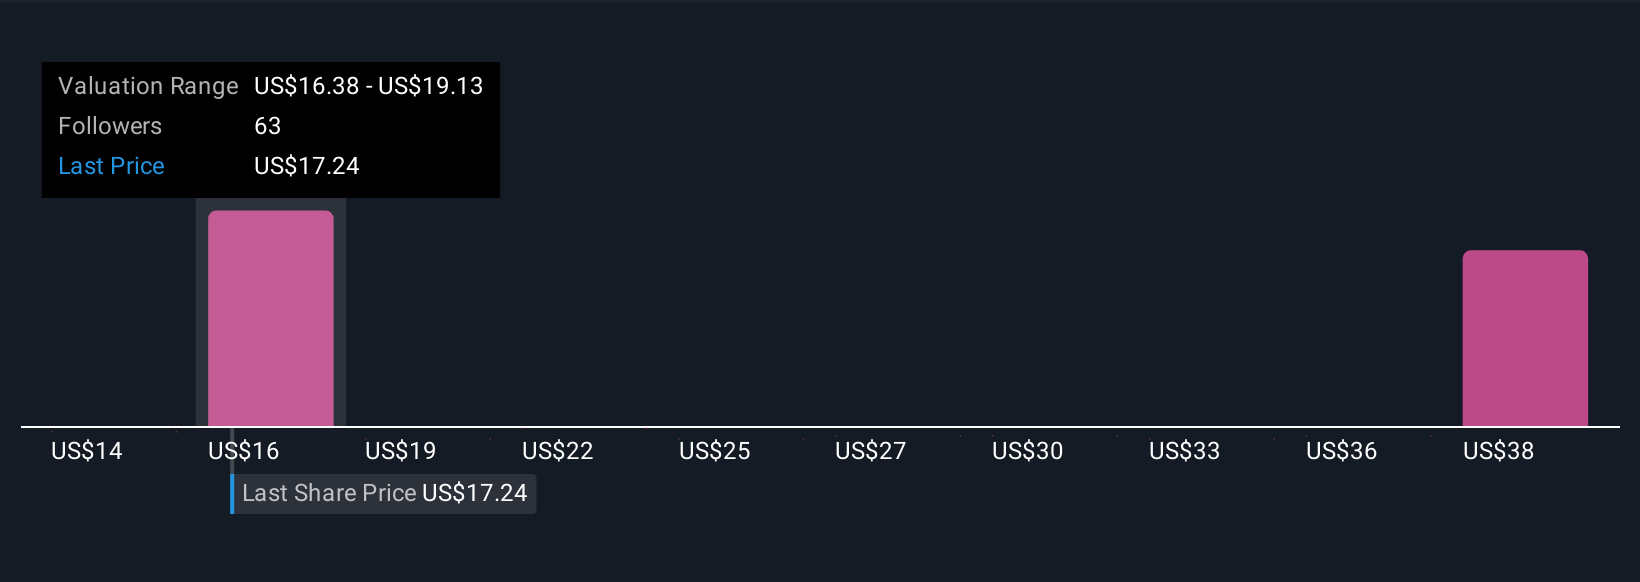
With Narratives, you can see at a glance whether your expectations justify buying, holding, or selling by directly comparing your estimated Fair Value to the market price, all while tracking how company news and earnings automatically refine those estimates. For example, the most optimistic StoneCo Narrative estimates a fair value of $19.97 per share, while the most cautious pegs it at $14.37, reflecting different views about Brazil’s fintech growth, competition, and profitability. Narratives make it simple to connect your investment decision to both your outlook for the business and the latest numbers, whenever things change.
Do you think there’s more to the story for StoneCo? Create your own Narrative to let the Community know!
 NasdaqGS:STNE Community Fair Values as at Oct 2025
This article by Simply Wall St is general in nature. We provide commentary based on historical data
and analyst forecasts only using an unbiased methodology and our articles are not intended to be financial advice. It does not constitute a recommendation to buy or sell any stock, and does not take account of your objectives, or your
financial situation. We aim to bring you long-term focused analysis driven by fundamental data.
Note that our analysis may not factor in the latest price-sensitive company announcements or qualitative material.
Simply Wall St has no position in any stocks mentioned.
We’ve created the ultimate portfolio companion for stock investors, and it’s free.
• Connect an unlimited number of Portfolios and see your total in one currency
• Be alerted to new Warning Signs or Risks via email or mobile
• Track the Fair Value of your stocks
Have feedback on this article? Concerned about the content? Get in touch with us directly. Alternatively, email editorial-team@simplywallst.com