After months of climbing to record highs, markets were blindsided in mid-October by an abrupt escalation in the U.S.–China trade conflict. On October 10, former President Donald Trump unleashed a “shock tariff ultimatum” via social media, vowing to slap 100% tariffs on all remaining Chinese imports and scrapping an upcoming peace summit with China’s President Xi [33] [34]. Beijing had moved to tighten exports of critical rare-earth minerals days prior, and Trump’s furious response signaled “Trade War 2.0” was on. The aggressive rhetoric stunned investors and “rattled markets”, erasing optimism that had driven stocks to all-time highs just the day before [35] [36].
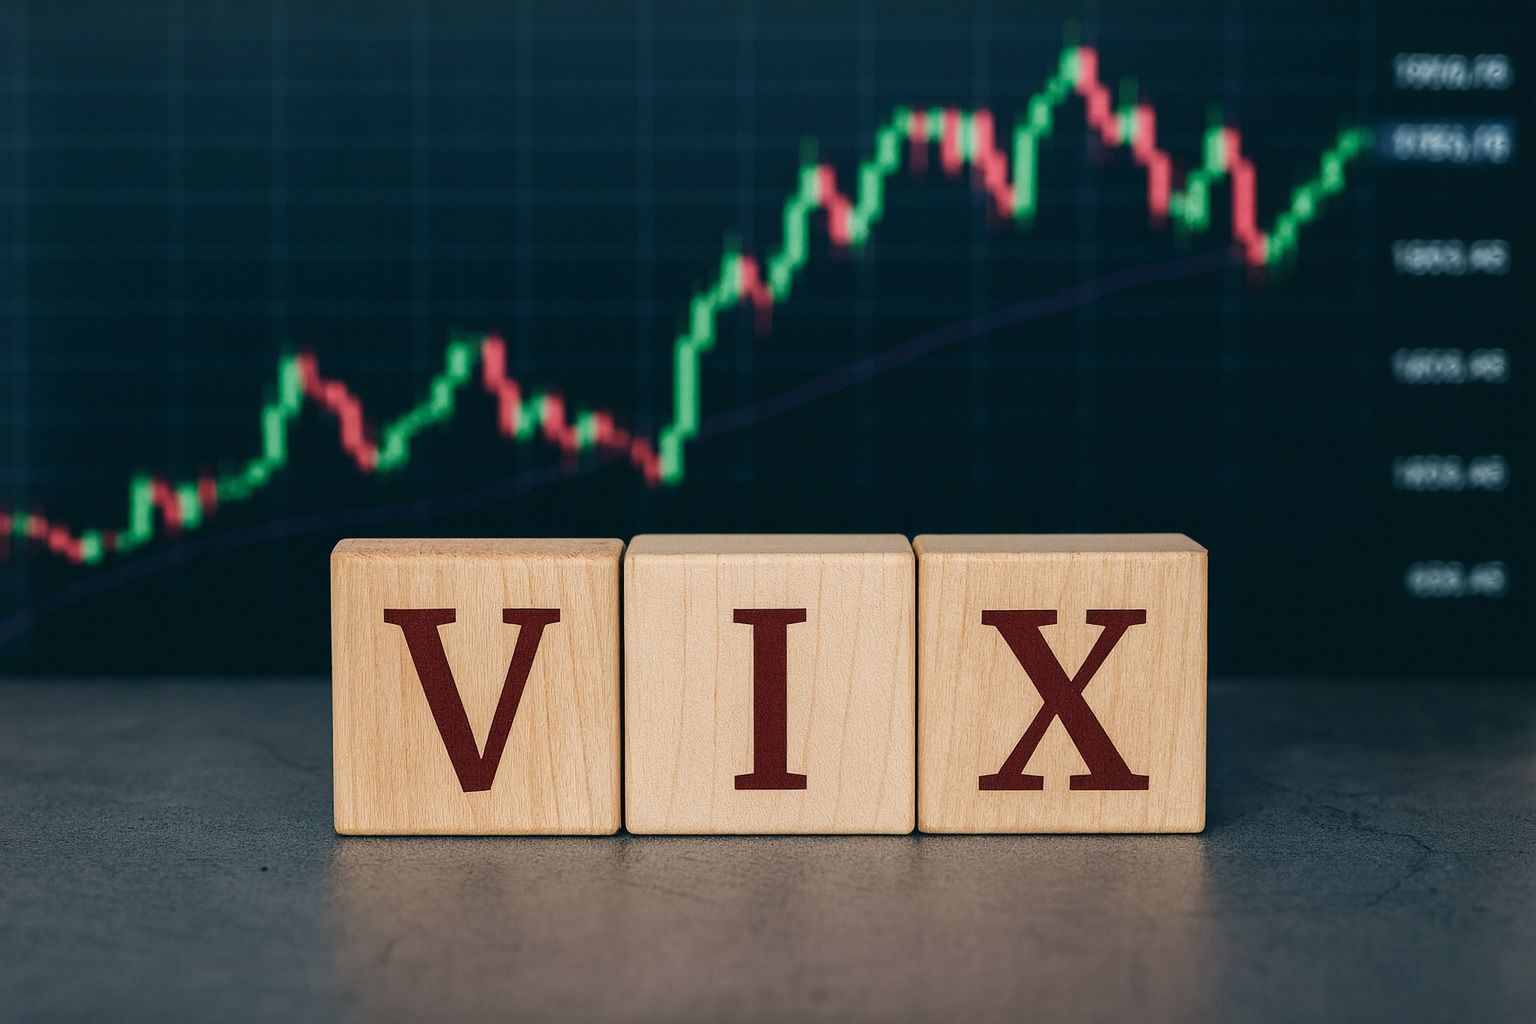
Wall Street reacted swiftly and violently. Stocks plunged worldwide in what media dubbed a trade war “tariff tantrum.” The S&P 500 tumbled 2.7% on Oct. 10 – its worst single-day drop since April – while the tech-heavy Nasdaq collapsed 3.6% [37] [38]. The Dow Jones Industrial Average lost nearly 900 points (-1.9%) [39]. All three major U.S. indexes suffered their steepest weekly declines in five months after the sudden sell-off [40]. “The second largest economy and the first largest economy are arguing again, and we’re seeing a sell-first, ask-questions-later mentality to end the week,” observed Carson Group strategist Ryan Detrick [41]. He noted Trump’s post “truly came out of nowhere,” unleashing volatility not seen in a long time [42]. Indeed, the market’s fear gauge (VIX) spiked to its highest level since mid-summer as traders rushed for protection [43].
Technology and trade-sensitive stocks bore the brunt. Semiconductor and Big Tech names sank, with Nvidia, Tesla, Amazon and AMD each falling over 2% after-hours as Trump’s newly announced export curbs on U.S. software threatened global tech supply chains [44] [45]. “Big Tech shares [were] tumbling” on the tariff news [46]. Overseas, global markets mirrored the U.S. rout: Europe’s STOXX 600 index fell ~1.2% and Asian markets from Tokyo to Hong Kong all slid ~1–2%+ in sympathy [47] [48]. By the closing bell, Wall Street had wiped out its entire October gain in a matter of hours [49].
This dramatic reversal came after stocks had been basking in euphoria only days earlier. In fact, the S&P 500 and Nasdaq set record highs on Oct. 9 amid investor optimism over artificial intelligence (AI) boom and expectations of Federal Reserve rate cuts [50]. Even a U.S. government shutdown that began Oct. 1 hadn’t dented sentiment – until the trade war headlines hit [51]. “President Trump’s post did truly come out of nowhere, which opened the door for some extreme volatility,” Detrick said [52], adding that after such a prolonged calm, “one could argue we were due for some spookiness this October.” The shock tariff salvo proved to be that catalyst, abruptly ending the market’s melt-up and reminding investors that geopolitical risk can strike at any time.
“Sell” Signals Flashing, But Key Level in Focus
The sudden sell-off has put previously bullish technical indicators on notice. Market internals that were overwhelmingly positive a few weeks prior are now showing cracks. For example, volatility (VIX) spiked above 20 for the first time in months [53], and measures like the put/call options ratio and momentum gauges have begun tilting toward caution (indicating traders hedging or taking bearish bets). As one analyst quipped, “spookiness” has returned to a market that had been relentlessly steady [54]. These technical “sell signals” suggest heightened odds of further near-term downside or at least choppy trading [55].
Yet bulls see a silver lining: so far, key support levels are holding. Notably, the S&P 500 has remained above ~6,500, a level analysts cite as the line in the sand for this uptrend [56] [57]. 6,500 was roughly the index’s August high and represents strong chart support. Lawrence McMillan, a veteran options strategist, notes that as long as the S&P stays above that area, it can continue to “climb a ‘wall of worry’” despite the sell-off [58]. In other words, pullbacks that don’t violate major support may prove temporary. McMillan’s latest analysis acknowledges new sell signals appearing but emphasizes 6,500 as the number that matters most for the bull case [59].
So far, the market has tested but not broken that threshold. The S&P 500 fell as low as the mid-6,500s during the turmoil and closed around 6,629 on Oct. 16 [60] – above the danger zone. The Nasdaq likewise remains well above its summer lows (recently near 22,560 [61]). Chart watchers are also eyeing the trend of higher lows: despite volatility, each market pullback in 2025 has bottomed at a higher level than the last, signaling an ongoing uptrend. “This is one tough bull [market],” McMillan wrote late last month, noting that even amid overbought conditions and headline risks, the market’s overall trend has stayed positive [62] [63]. Still, if a decisive break below S&P 6,500 were to occur on heavy selling, it could herald a deeper correction. Below that, technicians point to the 6,340 area (August lows) and 6,200 (July lows) as next support zones [64].
For now, investors are watching if the current pullback finds a bottom or if downside momentum builds. Sentiment has undoubtedly become more brittle. “This feels like a rerun of 2023,” said IG Markets’ Chris Beauchamp after U.S. regional bank worries compounded the trade saga this week. “The market is struggling to digest [the] trade spat and…short-term, [this] spells trouble” he warned [65]. With sentiment skittish, even bullish traders agree that the market could be in for a bumpy ride in the coming weeks – unless reassuring news emerges on either the trade or economic front.
Liquidity Crunch: The Hidden Threat
Underneath the headline-grabbing tariff battle lies another, potentially deeper risk to the markets: tightening liquidity and credit conditions. Some experts argue that the “real market killer” stalking stocks now isn’t tariffs at all, but an evaporating pool of liquidity and mounting stress in debt markets [66]. “Beyond tariffs, liquidity is what really concerns me right now,” writes analyst James Foord, pointing to “clear warning signs that liquidity is running low.” [67] In essence, the worry is that the flood of easy money which buoyed markets in recent years is drying up – thanks to higher interest rates, Federal Reserve quantitative tightening, and cautious lending by banks – potentially leaving stocks without a safety net.
Recent credit flare-ups have put this issue in sharp relief. In the same week as Trump’s tariff drama, shock news hit from the U.S. regional banking sector, reviving memories of early 2023’s bank turmoil. Two mid-sized lenders – Zions Bancorp and Western Alliance Bancorp – revealed significant trouble with loans on their books, from surprise charge-offs to fraud allegations [68] [69]. These disclosures sent regional bank stocks plunging (an ETF tracking the sector dived ~6% in one day, the worst drop since April) [70]. Investors feared that if such “cockroaches” (hidden credit losses) are emerging at a couple of banks, there could be more lurking in the financial system [71] [72]. “This sort of debt can be difficult to map… it will take a while for the saga to play out,” noted Hargreaves Lansdown analyst Derren Nathan, referring to one bank’s exposure to a bankrupt auto-parts company with tangled, off-balance-sheet financing [73]. He added that while big banks remain well-capitalized and posted strong Q3 results, the episode has “done little to calm jitters” about contagion in credit markets [74].
These credit concerns tie back to liquidity: in a world of higher rates, marginal borrowers are under pressure, and lenders are less forgiving. The collapse of that auto-parts firm (First Brands Group) – which defaulted after racking up billions in hidden debts – is a case in point, highlighting fragility in the private credit market [75]. Even IMF Chief Kristalina Georgieva chimed in that risks in shadow banking and private credit “keep [her] awake at night” [76]. If more credit accidents surface, banks may tighten lending further, draining liquidity from the economy.
The Federal Reserve’s policies are a crucial part of this liquidity puzzle. Over the past year, the Fed’s rapid rate hikes and balance sheet runoff (QT) have been removing cash from the financial system. That hasn’t mattered much to stocks while investors were in a risk-on mood, but it could start to bite. In fact, Fed Chair Jerome Powell just indicated the Fed may end its QT program soon, acknowledging that financial conditions have tightened – yet ironically, as one MarketWatch piece noted, equities historically have fared better during periods of Fed tightening than after easing begins [77]. This counterintuitive pattern (stocks sometimes slump when the Fed pivots to cuts, perhaps due to why the Fed is cutting) underscores how liquidity shifts can rattle markets.
Foord, in his analysis, warns that liquidity stress is already evident in certain market indicators (like shrinking money supply growth or widening credit spreads) and could foreshadow a tougher environment for equities [78]. He suggests investors shouldn’t be complacent that only a trade war is at play – the credit cycle may be turning. If companies struggle to refinance debt or banks retrench lending, economic growth could slow and earnings estimates might fall, weighing on stocks beyond the tariff news. In short, the “liquidity time bomb” is a risk to monitor closely alongside the day-to-day trade headlines.
Fed Pivot Hopes – Will Rate Cuts Save the Day?
Amid these dual headwinds of trade and tightening credit, many on Wall Street are now looking to the Federal Reserve for relief. There is a growing expectation that the Fed will step in to cut interest rates and stabilize the situation. In fact, the recent market volatility and economic uncertainty have dramatically shifted the Fed outlook in the eyes of traders. Market futures are pricing in a near-certain rate cut at the Fed’s late-October policy meeting [79], which would be the second cut this year (following one in September).
Federal Reserve officials have hinted as much in public remarks. Christopher Waller, a Fed Governor, noted in an October 12 speech that the U.S. labor market has weakened, with job growth cooling, and stated he’d “support a [0.25%] rate cut” if data stays soft [80]. Separately, Stephen Miran, another Fed policymaker, went further – arguing the Fed should consider a half-point cut immediately to get ahead of risks [81]. “A quicker rate-cut path is necessary as trade tensions and heightened economic uncertainty amplify risks to growth,” Miran has said [82]. These dovish signals represent a notable shift from just a few months ago, when the Fed was still raising rates to fight inflation. With inflation seemingly tamer (and now a lack of fresh data due to the shutdown), the Fed’s focus has shifted to supporting the economy [83].
Investors have cheered the prospect of easier monetary policy. Lower interest rates typically reduce borrowing costs for businesses and lift asset valuations, providing a tailwind to stocks. Indeed, part of the market’s resilience earlier in October was due to rising hopes of Fed rate cuts. For example, on October 13, after the worst of the sell-off, U.S. stocks staged a sharp rebound – the Dow jumped over 300 points and the Nasdaq nearly 2% – fueled by anticipation that the Fed would respond to the turmoil with accommodation [84] [85]. “Markets are…bullish thanks to Federal Reserve comments,” noted one report as stocks rallied mid-week [86]. Even as trade worries festered, the idea that “the Fed has our back” helped soothe investors.
However, the effectiveness of a Fed rescue is a matter of debate. Skeptics point out that rate cuts can’t reopen the government or instantly resolve a trade war. More so, if the Fed is cutting because growth is faltering, corporate earnings could suffer – a bad sign for stocks. Lori Calvasina, head of U.S. equity strategy at RBC, cautions that while Fed easing is welcome, the market’s underlying health (consumer spending, credit quality, etc.) is now in question [87]. The ongoing government shutdown, now the longest in U.S. history by its third week, means key data on the economy (like jobs and inflation reports) aren’t being released [88]. This data void makes the Fed’s job trickier and leaves investors “flying blind” on fundamentals. If rate cuts come amid such uncertainty, they may not be the panacea bulls hope for.
In the near term, though, a Fed rate cut (or even just strong hints of one) could provide a psychological boost. Bond yields have already retreated from recent highs in anticipation of Fed easing – the 10-year Treasury yield fell below 4.1%, down from ~4.5% a month ago [89]. Lower yields make stocks more attractive in comparison. Moreover, easier policy could weaken the U.S. dollar (which had been at multi-month highs), potentially easing pressure on exports and commodities. There are signs this is unfolding: the U.S. dollar index just notched its worst week since August as traders bet on Fed cuts and a resolution to trade tensions [90] [91]. A softer dollar and cheaper credit combined create a more favorable backdrop for equities if other risks abate.
All told, the Fed’s next moves have become a critical focal point. The central bank’s late-October meeting will be closely watched for confirmation of a policy pivot. Fed Chair Powell has indicated that while inflation is near target, rising risks warrant flexibility, and he has emphasized the Fed “will act as appropriate to sustain the expansion.” Should the Fed deliver a cut or at least a dovish outlook, it may help cushion the market against further shocks. But if the Fed disappoints (by standing pat or sounding hawkish), markets could react negatively – especially given current jitters. As the saying goes, “Don’t fight the Fed” is a two-way street: investors are counting on the Fed to ride to the rescue, and any missteps could add to volatility.
Market Forecast: Turbulence Ahead, But No End of the Bull
Looking forward, the consensus is that market turbulence may persist in the short run, but most analysts do not foresee a full-blown bear market unless the economic backdrop deteriorates significantly. The list of worries is long – trade war uncertainty, high borrowing costs, political standoffs in Washington – yet the U.S. economy is still growing moderately and corporate earnings (so far in Q3) have been better than expected for many banks and tech companies. This suggests that while a 5–10% market pullback is possible (and arguably was overdue), a deeper crash would likely require a more severe economic downturn that is not yet evident [92] [93].
Many Wall Street strategists thus advise staying cautious but not panicking. UBS’s team, for instance, argues the recent sell-off is largely a sentiment-driven correction and not signaling recession: “We think the bull market remains intact,” UBS wrote, noting that as long as earnings growth and consumer spending stay positive, equities can regain upward momentum [94]. They recommend using volatility to accumulate quality stocks, especially in sectors like technology and AI that have strong long-term drivers [95]. Likewise, J.P. Morgan’s strategists see the 2025 uptrend resuming once trade headlines quiet down, though they acknowledge that near-term “incremental China risk” has increased market choppiness [96].
On the other hand, voices of caution highlight that the market is no longer cheap and that risks are piling up. The S&P 500 is still up significantly year-to-date and trading near historic highs, leaving less room for error if profits falter. Howard Marks, the famed investor, observed recently that U.S. stocks are “expensive, but not nutty” – rich valuations that could be justified by low rates, yet vulnerable if conditions change. He singled out one factor to watch: interest rates. If the Fed’s rate cuts don’t materialize or if inflation surprises on the upside, that could undermine the supportive low-rate environment underpinning high valuations. Furthermore, geopolitical wildcards remain – from the Middle East (energy prices) to Europe – any of which could add to volatility.
For now, much hinges on how the trade standoff evolves in coming days. Encouragingly, there have been some signs of de-escalation: after the initial shock, Trump and Chinese officials both signaled willingness to negotiate. Over the weekend following the sell-off, Trump remarked on Truth Social that “it will all be fine” with China and that he doesn’t want to “hurt” China’s economy [97]. This softer tone helped global markets rebound to start the next week [98] [99]. China, for its part, indicated it was open to talks despite condemning the tariff threats [100]. If the two sides return to the table or even agree to delay the tariff escalation (for example, a “tariff truce” beyond the current November 1 deadline), markets would likely rally on that news. Conversely, if rhetoric on either side intensifies again or concrete tariff actions hit (raising costs for companies and consumers), the market could retest its lows quickly.
In summary, investors should brace for a continued bumpy ride as we head deeper into the fourth quarter. The term “October effect” – the notion that October is often volatile for stocks – certainly rang true this year. Short-term risks (trade wars, credit jitters, political gridlock) are colliding with a market that had grown somewhat frothy. That combination has awakened volatility. Yet there are also stabilizers in place: the Fed’s likely easing, robust balance sheets at major banks, resilient tech sector earnings, and the fact that U.S. households and businesses aren’t (yet) retrenching dramatically. This backdrop supports the case that the current turbulence is a healthy correction and not the start of a 2008-style collapse.
As analyst James Foord concludes, even if the S&P 500 slips in the next six months, the long-term trend remains upward barring a major economic shock [101]. In his view, staying invested in fundamentally strong companies through the volatility – while keeping an eye on liquidity and risk management – is the prudent course. The market is, in effect, undergoing a reality check, but not an obituary.
Investors would do well to heed both the warning signs and the strengths: sell signals are flashing, but so is the resilience of this bull market. The coming weeks will test whether 2025’s market can pass this test of nerves. If cooler heads prevail on the trade front and the Fed provides support, stocks may yet finish the year on a high note – climbing that proverbial wall of worry once again. If not, a bit more “spookiness” may be in store before clarity returns.
Sources: MarketWatch/Dow Jones [102]; Reuters [103] [104]; Barron’s [105]; TS² (TechStock²) Financial News [106] [107]; Seeking Alpha [108] [109]; The Guardian [110] [111].
$1.65 Trillion Wiped Out From Wall Street | World Business Watch
References
1. www.reuters.com, 2. www.reuters.com, 3. ts2.tech, 4. ts2.tech, 5. www.reuters.com, 6. www.reuters.com, 7. www.reuters.com, 8. ts2.tech, 9. www.reuters.com, 10. seekingalpha.com, 11. seekingalpha.com, 12. www.morningstar.com, 13. seekingalpha.com, 14. markets.financialcontent.com, 15. markets.financialcontent.com, 16. ts2.tech, 17. www.theguardian.com, 18. www.theguardian.com, 19. ts2.tech, 20. stockanalysis.com, 21. stockanalysis.com, 22. ts2.tech, 23. ts2.tech, 24. www.theguardian.com, 25. www.theguardian.com, 26. www.theguardian.com, 27. ts2.tech, 28. ts2.tech, 29. ts2.tech, 30. ts2.tech, 31. seekingalpha.com, 32. seekingalpha.com, 33. www.reuters.com, 34. www.reuters.com, 35. ts2.tech, 36. ts2.tech, 37. www.reuters.com, 38. www.reuters.com, 39. ts2.tech, 40. www.reuters.com, 41. www.reuters.com, 42. www.reuters.com, 43. www.reuters.com, 44. www.reuters.com, 45. www.reuters.com, 46. www.reuters.com, 47. ts2.tech, 48. ts2.tech, 49. ts2.tech, 50. ts2.tech, 51. ts2.tech, 52. www.reuters.com, 53. www.reuters.com, 54. www.reuters.com, 55. seekingalpha.com, 56. muckrack.com, 57. www.morningstar.com, 58. www.morningstar.com, 59. www.morningstar.com, 60. markets.financialcontent.com, 61. markets.financialcontent.com, 62. muckrack.com, 63. muckrack.com, 64. muckrack.com, 65. www.theguardian.com, 66. seekingalpha.com, 67. seekingalpha.com, 68. markets.financialcontent.com, 69. markets.financialcontent.com, 70. markets.financialcontent.com, 71. markets.financialcontent.com, 72. markets.financialcontent.com, 73. www.theguardian.com, 74. www.theguardian.com, 75. www.theguardian.com, 76. www.theguardian.com, 77. stockanalysis.com, 78. seekingalpha.com, 79. ts2.tech, 80. ts2.tech, 81. stockanalysis.com, 82. stockanalysis.com, 83. www.financecharts.com, 84. ts2.tech, 85. ts2.tech, 86. www.financecharts.com, 87. www.theguardian.com, 88. ts2.tech, 89. ts2.tech, 90. www.theguardian.com, 91. www.theguardian.com, 92. www.theguardian.com, 93. www.theguardian.com, 94. ts2.tech, 95. ts2.tech, 96. www.financecharts.com, 97. ts2.tech, 98. ts2.tech, 99. ts2.tech, 100. www.financecharts.com, 101. seekingalpha.com, 102. www.morningstar.com, 103. www.reuters.com, 104. www.reuters.com, 105. www.financecharts.com, 106. ts2.tech, 107. ts2.tech, 108. seekingalpha.com, 109. seekingalpha.com, 110. www.theguardian.com, 111. www.theguardian.com