
If you’re sizing up your next move with Amentum Holdings, you’re not alone. The stock has caught the attention of value investors and everyday traders alike, thanks to its rollercoaster performance over the last year. After closing recently at $22.55, Amentum’s price nudged up 0.7% in the past week but is nearly flat for the last month, down just 0.2%. Year-to-date, it’s up a respectable 4.1%. However, if you take a one-year view, the picture shifts, with the stock down 23.9%. This drop is rooted in lingering industry uncertainty and some shifting risk perceptions among investors.
Part of what has moved sentiment lately has been a series of announcements about strategic partnerships and expansion into new government contracts. These developments have investors debating whether the worst is behind Amentum, or if the market is still adjusting to potential upsides hidden in current pricing. Notably, the company is undervalued on 3 out of 6 key valuation checks, earning a value score of 3. This suggests some room for optimism, but also signals caution with the stock’s risk profile still in focus.
So, how do traditional valuation models stack up when it comes to Amentum? In the next section, we’ll break down these methods and consider their insights. Stay with us for a closer look at smarter ways to judge what the stock is really worth.
Why Amentum Holdings is lagging behind its peers
Approach 1: Amentum Holdings Discounted Cash Flow (DCF) Analysis
The Discounted Cash Flow (DCF) model estimates what a company is truly worth by projecting its future cash flows and then discounting them back to today’s value. For Amentum Holdings, analysts start with the company’s current Free Cash Flow of $139.5 Million and factor in expected growth rates to forecast future performance.
While Wall Street analysts typically provide detailed projections up to 2027, with an estimate of $654.0 Million in Free Cash Flow for that year, Simply Wall St extends these expectations further by extrapolating out ten years. Their longer-term projection shows Free Cash Flow approaching $912.5 Million by 2035, based on modest annual growth rates after analyst coverage ends.
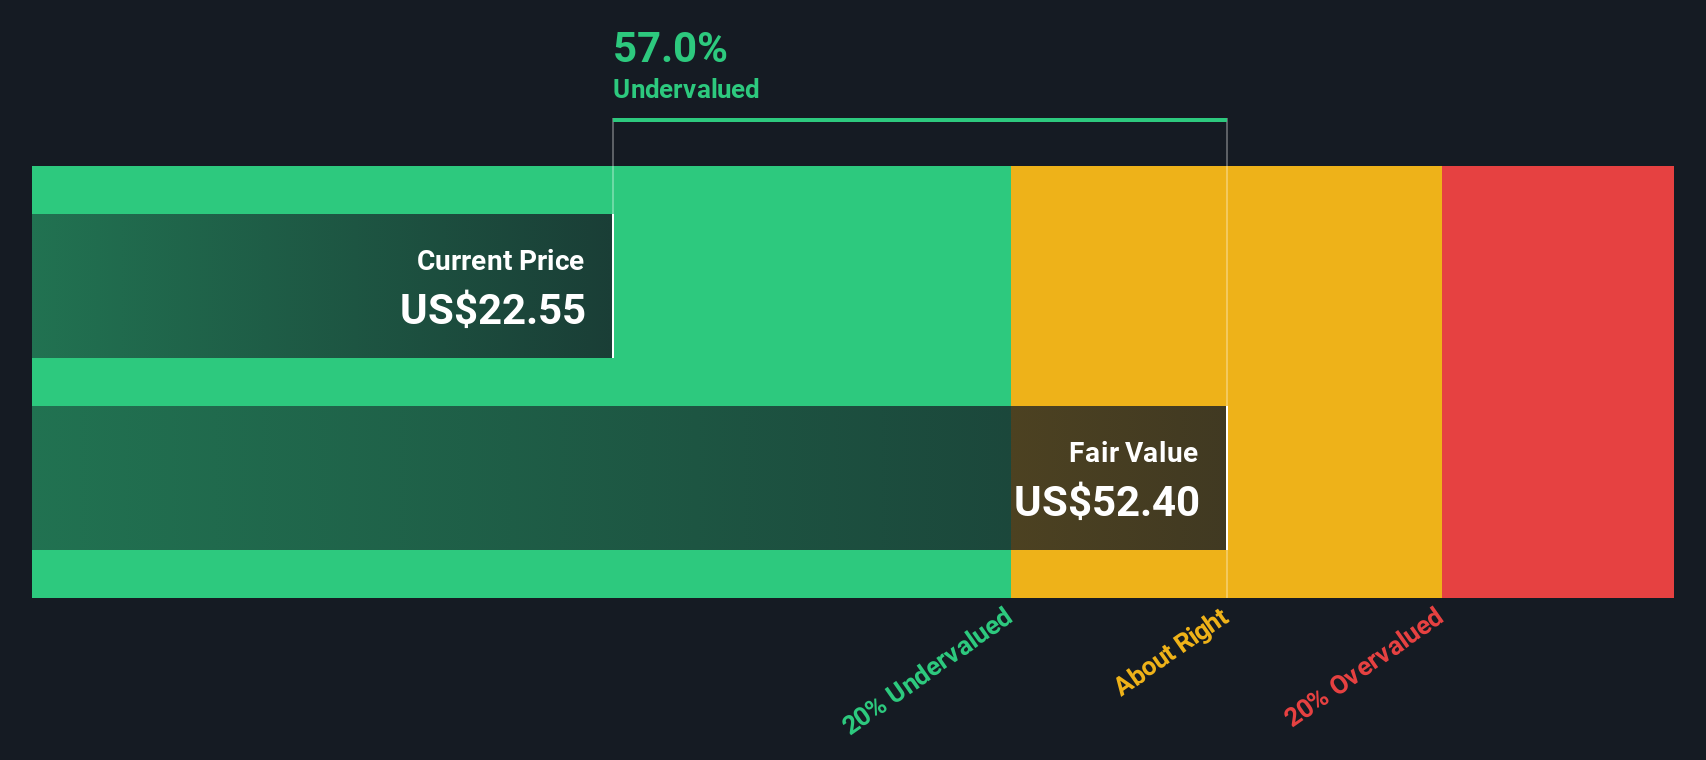
According to this 2 Stage Free Cash Flow to Equity model, Amentum’s intrinsic fair value lands at $52.40 per share, a significant premium to its recent closing price of $22.55. This signals the stock is trading at a 57.0% discount to its estimated value, utilizing all available forward-looking cash flow data.
For investors, this deep discount suggested by DCF points to meaningful upside potential if the company achieves or exceeds these projected numbers.
Result: UNDERVALUED
 AMTM Discounted Cash Flow as at Oct 2025
Our Discounted Cash Flow (DCF) analysis suggests Amentum Holdings is undervalued by 57.0%. Track this in your watchlist or portfolio, or discover more undervalued stocks.
Approach 2: Amentum Holdings Price vs Earnings (PE)
For profitable companies like Amentum Holdings, the price-to-earnings (PE) ratio is often a preferred way to weigh value, as it directly reflects how much investors are willing to pay for each dollar of current earnings. The “right” PE ratio isn’t a one-size-fits-all answer, since investor expectations for growth and the level of uncertainty or risk in a company’s future play a key role in setting a fair multiple. Higher growth prospects or lower perceived risks typically justify higher PE ratios, while slower growth or higher risks generally call for a discount.
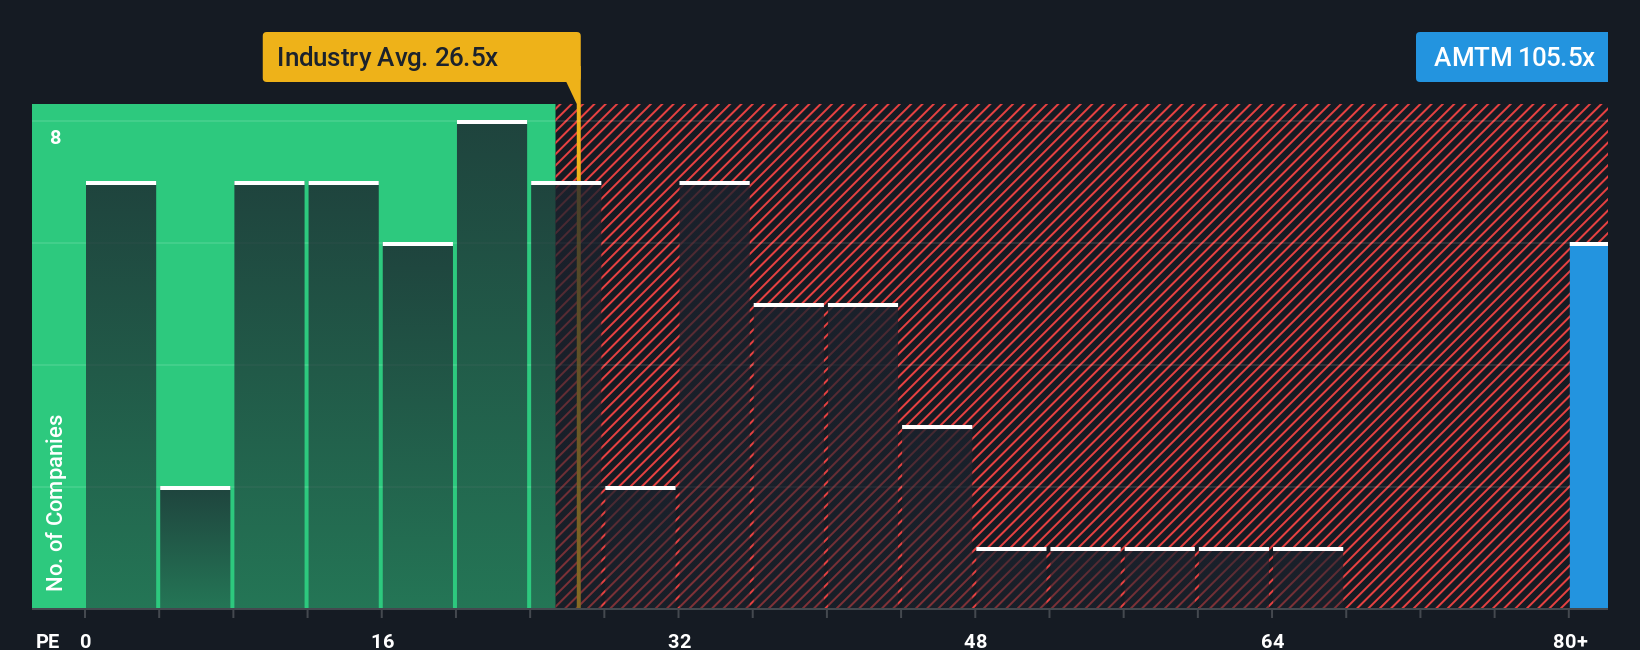
Currently, Amentum trades at a PE ratio of 105.5x, which stands out significantly when set against the Professional Services industry average of 26.5x and its peers’ average of 19.8x. At first glance, this high PE might suggest an overvalued stock, but multiples alone can be misleading without context. That is where Simply Wall St’s “Fair Ratio” enters the picture. This proprietary benchmark for Amentum, calculated at 44.3x, takes into account an array of inputs, including future growth potential, profit margins, business risks, scale, and the typical multiples seen in similar companies.
By providing a tailored reference point, the Fair Ratio offers a more nuanced way to judge value than simply benchmarking against peers or industry averages. In this case, Amentum’s current 105.5x PE is notably higher than its Fair Ratio of 44.3x, signaling investors are paying a significant premium over what the fundamentals would suggest is justified at present.
Result: OVERVALUED
 NYSE:AMTM PE Ratio as at Oct 2025
PE ratios tell one story, but what if the real opportunity lies elsewhere? Discover companies where insiders are betting big on explosive growth.
Upgrade Your Decision Making: Choose your Amentum Holdings Narrative
Earlier we mentioned there is an even better way to understand valuation, so let’s introduce you to Narratives. A Narrative is your story behind the numbers, letting you combine your assumptions on a company’s future, such as expected revenue, profit margins, and risks, into a forecast that links directly to a fair value. Narratives make it easy for anyone to connect Amentum Holdings’ story to the numbers, all in a visual, approachable way. This tool is available for free to millions of investors on Simply Wall St’s Community page.
With Narratives, investors decide when to buy or sell by comparing what they believe is fair value versus the current price, and their views update automatically as news or earnings reports roll in. For example, one investor might set a high Narrative fair value for Amentum if they see strong growth ahead, while another could see a much lower value if they expect challenges to persist. Narratives help you make smarter, dynamic decisions, your way and on your terms.
Do you think there’s more to the story for Amentum Holdings? Create your own Narrative to let the Community know!
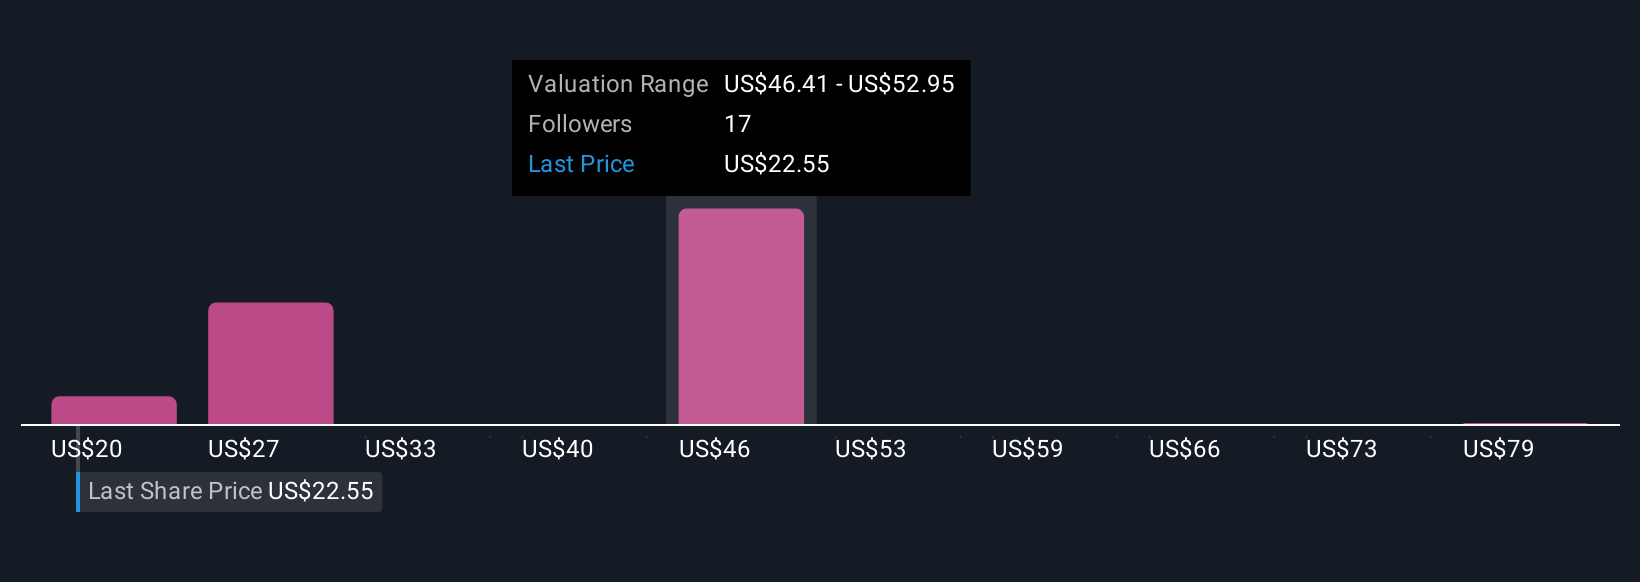 NYSE:AMTM Community Fair Values as at Oct 2025
This article by Simply Wall St is general in nature. We provide commentary based on historical data
and analyst forecasts only using an unbiased methodology and our articles are not intended to be financial advice. It does not constitute a recommendation to buy or sell any stock, and does not take account of your objectives, or your
financial situation. We aim to bring you long-term focused analysis driven by fundamental data.
Note that our analysis may not factor in the latest price-sensitive company announcements or qualitative material.
Simply Wall St has no position in any stocks mentioned.
We’ve created the ultimate portfolio companion for stock investors, and it’s free.
• Connect an unlimited number of Portfolios and see your total in one currency
• Be alerted to new Warning Signs or Risks via email or mobile
• Track the Fair Value of your stocks
Have feedback on this article? Concerned about the content? Get in touch with us directly. Alternatively, email editorial-team@simplywallst.com