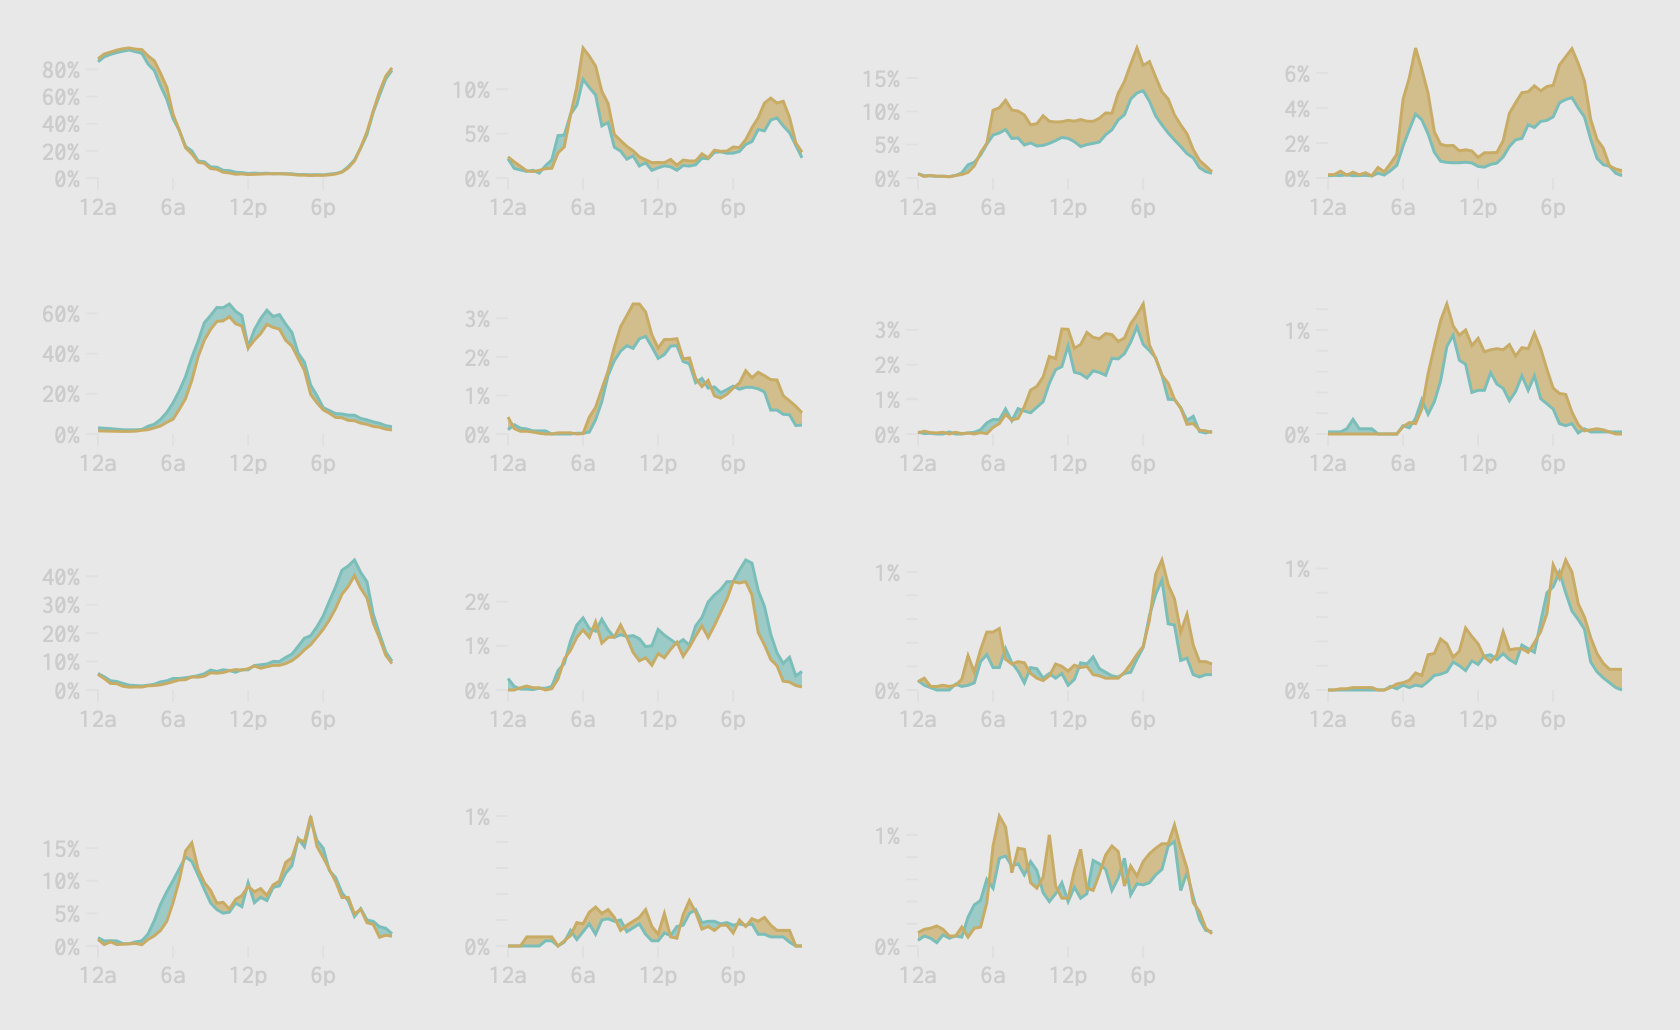
The design is a bit deceptive. Huge swathes of color for “0.3%” vs “0.7%”
Interesting but lacks rigor and completeness. Scales aren’t consistent, and you should theoretically have an equal amount of orange and turquoise, as nobody is ever truly doing “nothing”
Im angry they didnt add a stacked area vhart for each gender. This is so cool
Lol sorry but social media or phone attention should be a major one for both sexes.
There are people with several hours of phone screen time per day that excludes for working reasons
There may be different standards of acceptable messiness across the sexes. Also, if you want men to participate more in status harming or otherwise costly labor, you’re going to need to work towards reducing cost. If this labor was actually appreciated and monetarily compensated for, people would generally be more willing to do it.
“Status harming?” That’s crazy! Yes, people who do “femme coded” labor (or bulk) are treated inferior, all other things being equal. If the labor was properly dignified, women would instead be fighting to exclude men from it and keep the soft monopoly on that status building sector, just like how men try to exclude women from other sectors.
40% of people socialise after work on weekdays??
This is survey based data, so a more accurate title would be “How Men and Women Say They Spend Their Days”
I don’t understand the axis, the x seems to be the time of the day, and the y is “% time doing activity”, so like, 20% of women are doing house work at 6pm? Are they doing it for an hour? But it’s % of time, so 20% of the hour between 6 and …. The next time unit are spend doing housework by women?
I’m mega confused
The fact you can’t get full demo (unemployed+employed) is one problem. The other is that work/socializing are much larger numbers and that isn’t visually reflected.
9 comments
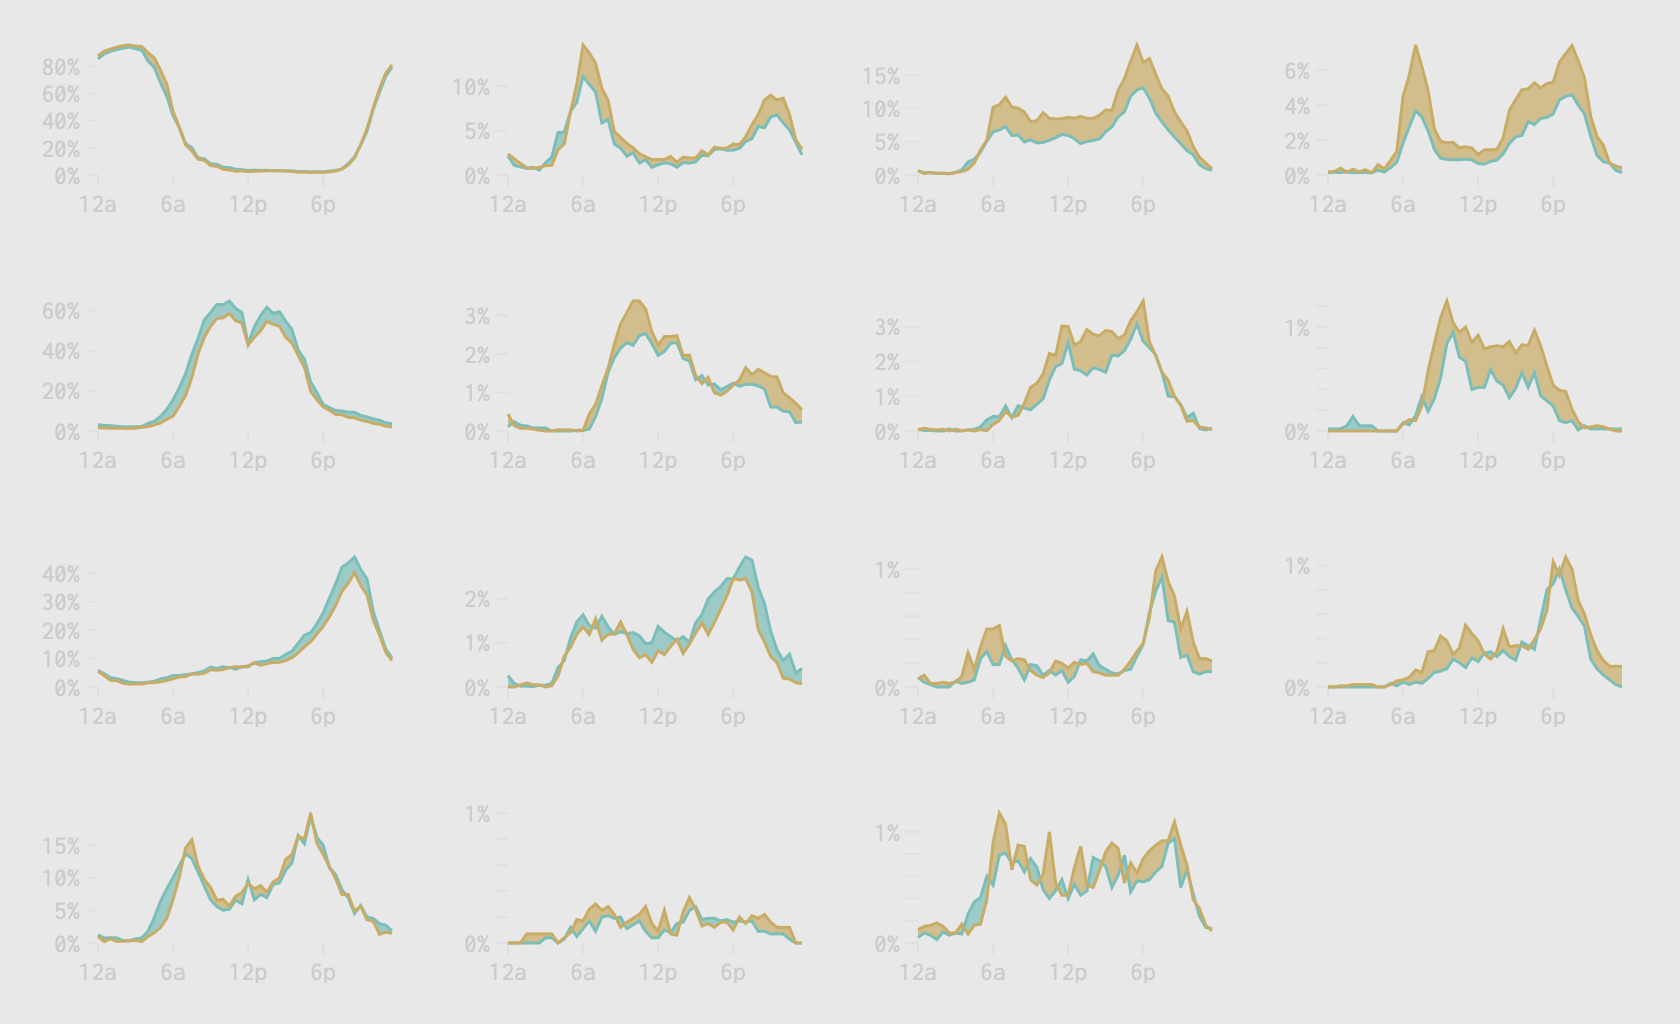
The design is a bit deceptive. Huge swathes of color for “0.3%” vs “0.7%”
Interesting but lacks rigor and completeness. Scales aren’t consistent, and you should theoretically have an equal amount of orange and turquoise, as nobody is ever truly doing “nothing”
Im angry they didnt add a stacked area vhart for each gender. This is so cool
Lol sorry but social media or phone attention should be a major one for both sexes.
There are people with several hours of phone screen time per day that excludes for working reasons
There may be different standards of acceptable messiness across the sexes. Also, if you want men to participate more in status harming or otherwise costly labor, you’re going to need to work towards reducing cost. If this labor was actually appreciated and monetarily compensated for, people would generally be more willing to do it.
“Status harming?” That’s crazy! Yes, people who do “femme coded” labor (or bulk) are treated inferior, all other things being equal. If the labor was properly dignified, women would instead be fighting to exclude men from it and keep the soft monopoly on that status building sector, just like how men try to exclude women from other sectors.
40% of people socialise after work on weekdays??
This is survey based data, so a more accurate title would be “How Men and Women Say They Spend Their Days”
I don’t understand the axis, the x seems to be the time of the day, and the y is “% time doing activity”, so like, 20% of women are doing house work at 6pm? Are they doing it for an hour? But it’s % of time, so 20% of the hour between 6 and …. The next time unit are spend doing housework by women?
I’m mega confused
The fact you can’t get full demo (unemployed+employed) is one problem. The other is that work/socializing are much larger numbers and that isn’t visually reflected.
Comments are closed.