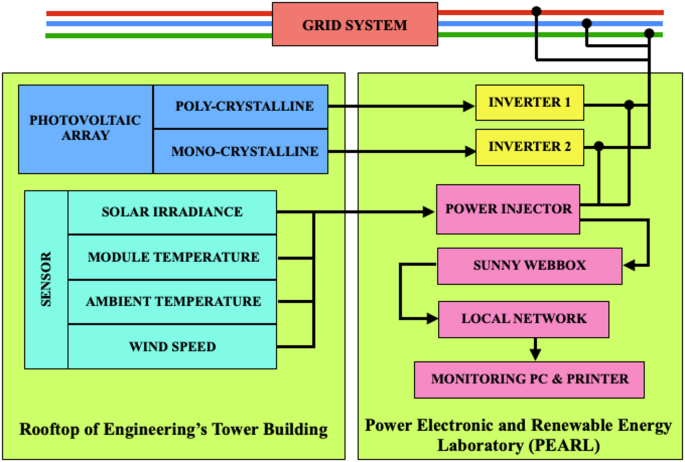
The subsequent section provides a comprehensive analysis and evaluation of eleven performance metrics and the degradation rate of the proposed forecasting method known as MAKIMA on both Array 1 and Array 2, respectively.
AC energy output performance
The monthly average output for 2020, 2021, and 2022 are shown in Fig. 4a, Fig. 4b, and Fig. 4c, respectively, while the average of module temperature are depicted in Fig. 4d, Fig. 4e, and Fig. 4f. The annual average \(\:{E}_{AC}\) and the module temperature across the assessment period are illustrated in Fig. 5a and Fig. 5b, respectively.
For Array 1, the highest outputs consistently occurred during the first half of the year (January to May) and October across all three years, while the lowest outputs were observed in June, July, August, September, November, and December. Specifically, in 2020, January saw the peak output (222.36 kWh), and June recorded the lowest output (176.15 kWh). In 2021, February reached the highest output (225.09 kWh), with August as the minimum (162.36 kWh). In 2022, the highest output occurred in January (202.36 kWh), with August showing the lowest (102.13 kWh). The annual average outputs were 200.88 kWh in 2020, 189.66 kWh in 2021, and 183.38 kWh in 2022.
For Array 2, the highest outputs were recorded in January, February, March, May, October, and December, while the lowest outputs were in April, June, July, August, September, and November. In 2020, January had the highest output (113.91 kWh), and June had the lowest (95.80 kWh). In 2021, October recorded the peak output (109.00 kWh), with September showing the lowest (82.99 kWh). In 2022, the highest output occurred in December (102.92 kWh), while the lowest was in August (61.50 kWh). The annual averages were 109.93 kWh in 2020, 97.64 kWh in 2021, and 93.42 kWh in 2022.
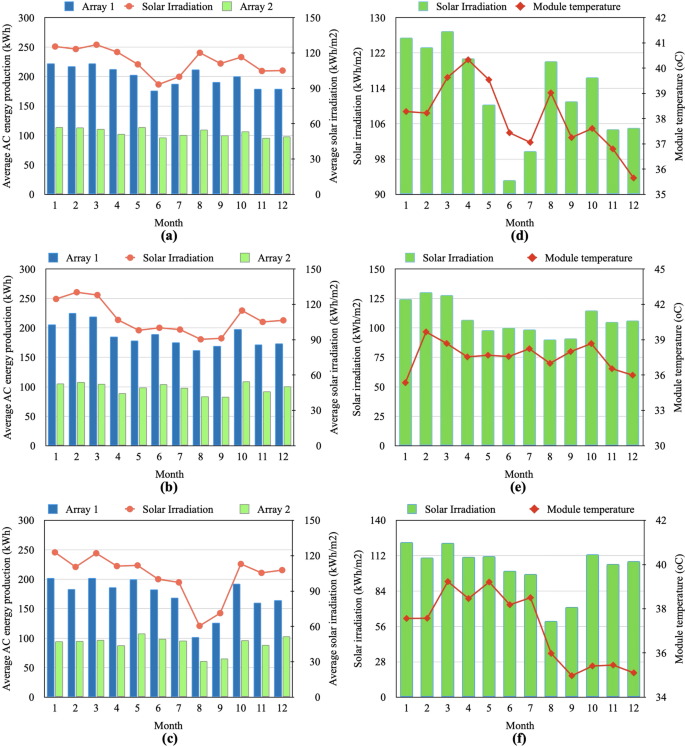
Comparison of AC energy production (a) to (c) and monthly average module temperature (d) to (f) for 2020, 2021, and 2022.
The monthly average module temperatures over the period from 2020 to 2022 displayed in Fig. 4d to Fig. 4f shows a clear correlation between monthly solar irradiation and module temperature across the three-year assessment period. In general, months with higher solar irradiation corresponded with elevated module temperatures, reflecting the direct influence of solar energy absorption on the thermal behavior of PV modules. In 2020, March recorded one of the highest irradiation values (126.97 kWh/m²), coinciding with the peak module temperature of 40.33 °C in April, likely due to thermal inertia and sustained irradiance over the preceding weeks. Similarly, in 2021, February showed the highest irradiation level (130.25 kWh/m²), aligning with a notable module temperature of 39.66 °C. A comparable pattern was observed in 2022, where March received 122.08 kWh/m² of irradiation and exhibited a module temperature of 39.23 °C. Conversely, months with lower irradiation, such as August and September in 2022, when irradiation dropped to 60.47 kWh/m² and 71.29 kWh/m², corresponded with the lowest module temperatures (35.98 °C and 34.97 °C). These findings reinforce the well-established relationship between irradiance and module temperature, whereby higher solar input intensifies thermal loading on the module surface. However, interannual variability, particularly in 2021, also suggests that other meteorological factors such as ambient temperature, wind speed, and cloud cover, can modulate this relationship, occasionally leading to deviations from a strictly linear trend.
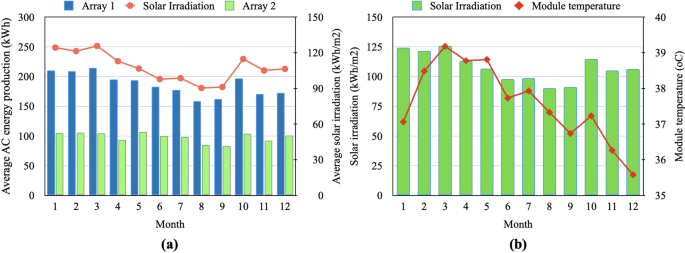
Annual assessment of (a) average output of AC energy and (b) average module temperature.
Figure 5a illustrated the overall average AC energy output from Array 1 was 2.24 MWh, while Array 2 generated 1.18 MWh, resulting in a combined total of 3.42 MWh during the assessment period. Both arrays consistently achieved their highest outputs between January and March, with the lowest recorded in August and September, particularly in 2021 and 2022. This drop aligns with Malaysia’s monsoon season, marked by increased cloud cover and rainfall, which diminishes solar radiation. A notable trend is the decline in energy output over the three years. Array 1’s output fell from 200.88 kWh in 2020 to 183.38 kWh in 2022, while Array 2’s output decreased from 109.93 kWh in 2020 to 93.42 kWh in 2022. This reduction reflects growing climatic variability, potentially influenced by cloud cover, rainfall, and other atmospheric factors.
Figure 5b presents the monthly average module temperatures for the evaluation year ranged from 35.58 °C to 39.18 °C, consistent with the thermal behavior expected in PV systems. Throughout the year, higher levels of solar irradiation generally coincided with elevated module temperatures, indicating that solar energy input is a primary driver of thermal loading on PV modules. March recorded one of the highest irradiation levels (125.65 kWh/m²), with the module temperature peaking at 39.18 °C. Similarly, January and February exhibited high irradiation values of 124.29 kWh/m² and 121.35 kWh/m², respectively, which corresponded to elevated module temperatures of 37.06 °C and 38.48 °C. Conversely, the lowest module temperatures were observed in December (35.58 °C) and November (36.26 °C), aligning with moderate irradiation levels of 106.42 kWh/m² and 105.08 kWh/m². Overall, the thermal profile reflects typical seasonal variation, with elevated temperatures during the first half of the year and a gradual decline toward the end. These trends are particularly relevant for PV system performance, as sustained high module temperatures can reduce energy conversion efficiency due to the negative temperature coefficient of power output.
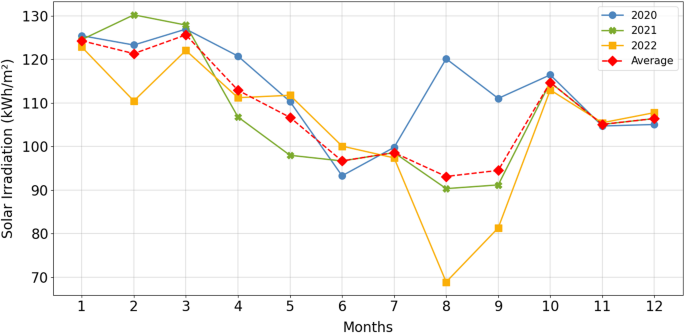
The solar irradiation production throughout the assessment period.
The annual global horizontal irradiation (GHI), depicted in Fig. 6, decreased over the same period from 1357.37 kWh/m² in 2020 to 1233.83 kWh/m² in 2022, showing a clear negative correlation between solar irradiation and energy generation, especially in June through September. The sharp decline in GHI in August 2022 (60.47 kWh/m²) and September (71.29 kWh/m²) is particularly significant. The impact of high rainfall and cloud cover during these months demonstrates the challenge posed by Malaysia’s monsoon season. The reduced GHI levels resulted in a substantial drop in energy output, with Array 1 generating just 102.13 kWh and Array 2 producing only 61.50 kWh in August 2022. This suggests that seasonal weather patterns play a critical role in solar power generation, where periods of high cloud cover, especially during the monsoon, can severely limit energy capture.
The data shows that the lowest energy outputs typically occurred during the Southwest Monsoon period (from late May to September), which is associated with increased cloud cover and heavy rainfall, reducing solar radiation. In contrast, the Northeast Monsoon (from November to March) and inter-monsoon periods (from April to May and October to November) are characterized by clearer skies and less rainfall, resulting in higher solar radiation and consequently higher energy outputs. This seasonal and transitional weather pattern highlights the significant impact of local climatic conditions on solar energy generation, particularly in tropical regions like Malaysia. Therefore, when designing solar PV systems in such environments, it is essential to consider these seasonal variations. Additionally, integrating alternative energy sources or enhancing energy storage systems to manage the effects of cloud cover and rainfall during the monsoon and inter-monsoon periods can help ensure a stable and reliable energy supply.
System yields
Figure 7 presents the monthly average array yield over the assessment period, revealing significant seasonal variations in energy production. The highest average array yields for both arrays were observed in January, February, March, and October, while August recorded the lowest values. Specifically, the average array yield for Array 1 ranged from 87.43 h to 118.55 h, while Array 2 exhibited yields between 50.13 h and 65.52 h. The cumulative array yields for 2020, 2021, and 2022 showed a progressive decline for Array 1, from 1295.56 h to 1133.14 h, and for Array 2, from 736.89 h to 668.61 h.
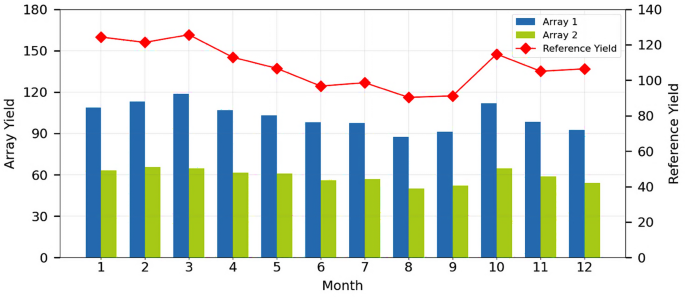
Monthly average array yield during the period of assessment.
This image is for Fig. 2aFigure 8 further illustrates the monthly average final yield, with Array 1 exhibiting its highest average final yield in January (105.08 h), February (104.34 h), and March (107.36 h), and its lowest in August (79.37 h) and September (81.09 h). The monthly average final yield for Array 1 ranged from 79.37 h to 107.36 h, with total yields of 1201.51 h in 2020, 1123.95 h in 2021, and 1035.98 h in 2022. In contrast, for Array 2, the lowest monthly average yields were recorded in February (56.27 h) and May (56.99 h), with the lowest yield of 44.25 h occurring in September. The monthly average array yield for Array 2 ranged from 44.25 h to 56.99 h, and its total yield was 674.51 h in 2020, 625.75 h in 2021, and 582.83 h in 2022.
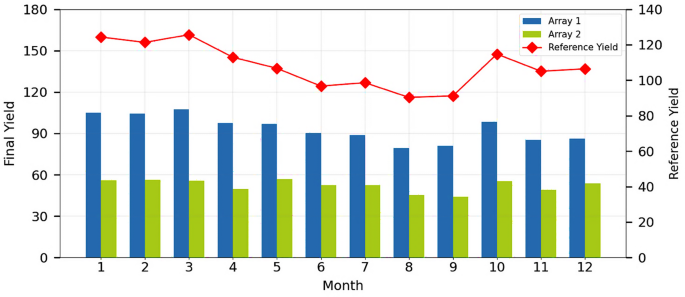
Monthly average final yield during period of assessment.
The reference yield values obtained during the assessment period highlight significant seasonal variability. Peak yields were observed in January (124.29 kWh), February (121.35 kWh), and March (125.65 kWh), which can be attributed to the optimal conditions for energy generation during the Northeast Monsoon. This period is characterized by clearer skies and reduced rainfall, resulting in a more favorable alignment of actual solar irradiance with the system’s theoretical capacity. In contrast, the lowest reference yield was recorded in August (90.32 kWh), reflecting the impact of the Southwest Monsoon, during which increased cloud cover and reduced sunlight significantly limited the PV system’s potential output.
This analysis underscores the profound influence of climatic and seasonal factors on the performance of solar PV systems. Higher yields in the first quarter of the year demonstrate the advantage of clearer skies and less precipitation, while the significant drop in mid-year energy output highlights the constraints imposed by the monsoon seasons. These findings are crucial for the design and optimization of solar energy systems in tropical climates, such as Malaysia, where integration of complementary energy sources or advanced energy storage systems may be necessary to ensure a consistent and reliable energy supply throughout the year.
Capacity factor
The monthly CF for both Array 1 and Array 2, illustrated in Fig. 9, offers critical insights into the operational efficiency of the PV systems. The highest CF values were recorded between January and May, with values ranging from 10.22% to 11.81%, indicative of favorable weather conditions that facilitated optimal energy generation. In contrast, the lowest CF was observed in August and September, recorded at 8.39% and 8.70%, respectively. Notably, a marked improvement of 1.64% in capacity factor was observed from September to October, highlighting the transition to the inter-monsoon phase, which brings clearer skies and more consistent sunlight. This shift underscores the importance of understanding how seasonal transitions impact energy output, as changes in cloud cover and precipitation directly affect solar radiation availability. February emerged as the month with the highest capacity factors for both arrays, with Array 1 recording 15.34% and Array 2 8.27%. These values reflect optimal energy generation conditions, attributed to stable, clear weather. Conversely, August showed the lowest capacity factors, with Array 1 at 10.67% and Array 2 at 6.11%.
Annually, the overall average monthly CF for Array 1 was 12.79%, compared to 7.16% for Array 2. This discrepancy highlights the impact of system design, particularly the material and efficiency of the panels, in determining overall performance. Array 1’s higher CF suggests that Polycrystalline panels may offer superior performance in fluctuating weather conditions compared to Array 2’s potential use of Monocrystalline panels. This comparison emphasizes the importance of carefully selecting panel types and system configurations to optimize performance in regions subject to seasonal variations and unpredictable weather patterns. The findings reinforce the critical influence of local weather patterns on solar PV performance, particularly in tropical regions where shifts between rainy and dry seasons significantly impact energy output.
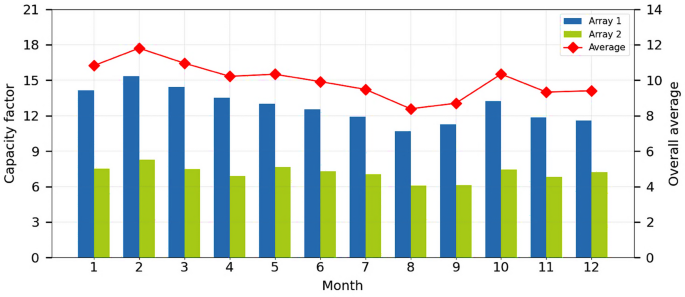
Monthly average of capacity factor generated for two arrays.
Performance ratio
Figure 10 illustrates the monthly averages of the PR for both arrays. For Array 1, the highest PR was recorded in June at 93.51%, suggesting optimal system performance during this month. In contrast, Array 2 achieved its highest PR in December at 62.45%, which can be attributed to relatively stable weather conditions conducive to efficient energy conversion. On the other hand, the lowest PR for Array 1 was observed in November (81.13%) and December (81.06%), while Array 2 exhibited its lowest PR values in March (51.87%) and April (51.03%). These lower PR percentages indicate a potential deterioration in system efficiency, likely caused by less favorable weather conditions, including increased cloud cover, reduced sunlight, and possible fluctuations in temperature. The annual average PR for Array 1 and Array 2 were 87.81% and 45.55%, respectively, reflecting a notable difference in their overall performance. The higher PR of Array 1 highlights the influence of system design and possibly panel quality, which contribute to its ability to perform better under a wider range of conditions. The overall PR of the system, at 82.9%, serves as a benchmark for evaluating the overall performance of the PV system.
When comparing the performance of the PEARL PV system with other similar studies, it is clear that Array 1 demonstrates superior performance with a PR of 87.81%. This figure surpasses the PR typically reported in similar settings, reflecting the optimized design of the system, which likely includes high-quality panels, advanced inverters, and a strategically chosen installation site. This comparison further emphasizes the importance of not only the geographical location but also the climatic factors and system maintenance protocols when designing and evaluating PV systems.
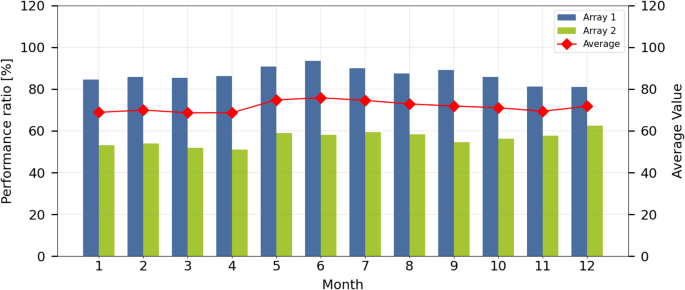
Monthly average on PR for two arrays during the period of assessment.
The efficiency of the PEARL PV system
Figure 11 presents the monthly average efficiencies for the array, system, and inverter components of both Array 1 and Array 2, as depicted in Fig. 11a, Fig. 11b, and Fig. 11c, respectively. These efficiency parameters are crucial indicators of the overall performance and operational effectiveness of the PV system throughout the assessment period.
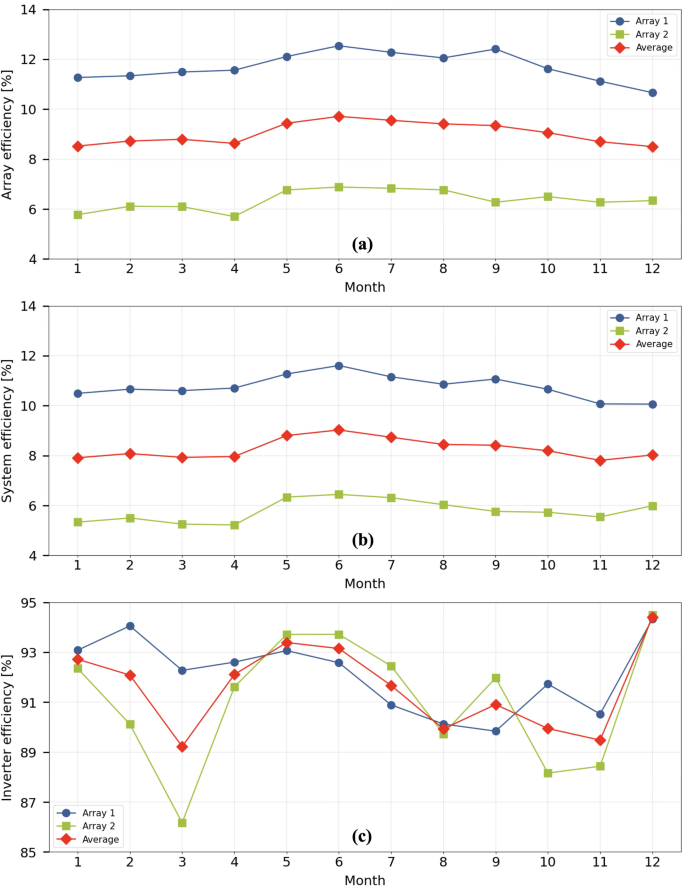
Monthly average efficiency of two arrays for the (a) array, (b) the system, and (c) inverter.
Figure 11a illustrates the monthly average array efficiency, revealing that the overall efficiency reached its peak between May and October, with values ranging from 9.06% to 9.71%. The lowest efficiencies occurred in January (8.52%) and December (8.50%). Array 1 demonstrated its highest efficiency during the summer months, specifically from May to September, with a peak of 12.54% in June, while its lowest efficiency was recorded in December at 10.66%. Array 2 exhibited its highest efficiency during the same period, although its lowest efficiency was observed in April (5.70%). The positive trend in array efficiency from April to June is indicative of the system’s optimal performance under conditions of increased sunlight exposure, minimal cloud cover, and moderate ambient temperatures. Notably, Array 1 consistently outperformed Array 2, highlighting its superior ability to convert solar energy into electrical power under varying environmental conditions.
Figure 11b depicts the monthly average system efficiency, which reflects the overall capacity of the PV system to convert solar energy into usable electricity. Both Array 1 and Array 2 achieved their highest system efficiency in June at 9.03%. For Array 1, system efficiency ranged from 10.02% to 11.61%, while for Array 2, it fluctuated between 5.26% and 6.45%. A notable efficiency increases of 9.5% from April to May underscores the significance of enhanced sunlight exposure and favorable environmental conditions. Despite fluctuations in solar radiation, both arrays maintained relatively stable system efficiencies, demonstrating the robustness of the system to compensate for seasonal and environmental variations. These results emphasize the importance of optimal sunlight exposure, moderate ambient temperatures, and low humidity levels in maintaining high system efficiency throughout the operational period.
Figure 11c illustrates the monthly average inverter efficiency for both arrays. Array 1 consistently exhibited higher inverter efficiency than Array 2, with a peak efficiency recorded in December (94.41%) and the lowest recorded in March (89.22%). Efficiency reductions were observed during the periods from January to March and from September to October, with decreases of −3.21% and − 1.12%, respectively. Conversely, efficiency improvements were noted from April to May and from November to December, with increases of 3.13% and 5.22%, respectively. The annual average inverter efficiency for Array 1 was 92.09%, while for Array 2, it was slightly lower at 91.08%. The lowest inverter efficiencies for the year were observed in October (89.84%) for Array 1 and in March (86.17%) for Array 2, further suggesting the seasonal influence on inverter performance. Interestingly, both arrays exhibited similar efficiency trends in April, May, August, and September, with December emerging as the month with the highest inverter efficiency, likely driven by favorable weather conditions that optimize solar energy capture.
The findings from the study by Ketjoy et al.38 corroborate the observed seasonal variations in inverter efficiency. The research, which evaluated inverter performance over three years, reported minimal degradation, with only a −1% reduction in efficiency due to the inverter being housed in an air-conditioned environment. Furthermore, their study highlighted March as a period of optimal inverter efficiency, aligning with the highest solar irradiation and longest sunlight duration. The efficiency analysis presented in this study demonstrates that both Array 1 and Array 2 exhibit performance patterns that are strongly influenced by environmental conditions, with Array 1 consistently outperforming Array 2 across all efficiency metrics. The results further emphasize the importance of considering seasonal variations, solar radiation, temperature fluctuations, and system design when evaluating the performance of PV systems.
Losses of array and the system
Figure 12 shows the monthly average array losses for two arrays. Both Array 1 and Array 2 experienced their highest losses in December, recording 15.03 h and 69.96 h, respectively. The lowest losses for both arrays were observed in September, with values of 0.20 h for Array 1 and 44.16 h for Array 2. On average, system losses for Array 1 and Array 2 were 6.48 h and 55.52 h, respectively. A significant discrepancy is evident, with Array 2 consistently incurring higher losses than Array 1. While Array 1’s losses ranged from 0.20 h to 15.03 h, Array 2 exhibited more pronounced fluctuations and higher peaks. The lowest value for Array 1 in September is attributed to the seasonal effects of the monsoon, where high humidity and rainfall lower ambient temperatures. This reduction in temperature has been proven to enhance PV module performance by improving efficiency and reducing array losses. Studies by Akhter et al.18 and Adaramola et al.39 show that solar radiation levels are typically lower during periods of high humidity, which often coincide with heavy rainfall. Additionally, the accumulation of water droplets on the PV modules from rainfall and the humid environment aids in cooling the modules by facilitating heat transfer through evaporation, further improving array performance during the rainy months.
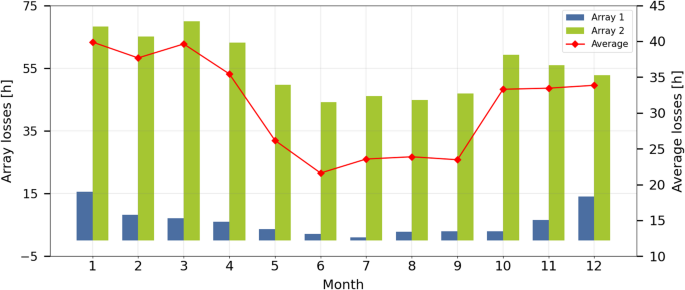
Monthly average array losses for two arrays.
The observed high losses in December for both arrays, particularly for Array 2, warrant a closer examination of the environmental conditions during this period. December typically corresponds with the tail end of the monsoon season, suggesting that while the weather may stabilize, other factors such as dust accumulation or micro-climatic effects might contribute to the increased losses observed. Additionally, while Array 1 shows relatively consistent performance throughout the year, the higher losses in Array 2 suggest possible manufacturing mismatch issues, which have been documented in similar studies conducted by Amin et al.40 and Chekal Affari et al.41. These discrepancies are often linked to manufacturing defects and aging, as noted by the authors, but this study identifies aging as a primary cause of high array losses. The impact of such aging, especially without regular maintenance and cleaning, could lead to a degradation in the module’s ability to convert sunlight into energy, compounding overall system losses.
Monthly average system losses for two arrays.
The overall average system losses for Array 1 (7.98 h) and Array 2 (8.00 h) in Fig. 13 highlight the performance gap between the two arrays. Both arrays experienced the highest losses in September (10.01 h) for Array 1 and in March (12.15 h) for Array 2. These high losses are likely influenced by particulate matter or reduced solar radiation during seasonal transitions. This suggests that the system’s sensitivity to environmental shifts warrants further monitoring, particularly during such periods, to better capture these effects. The lowest losses occurred in December, with 5.16 h for Array 1 and 6.01 h for Array 2, possibly due to the monsoon’s cooling effect. However, this also suggests that factors like inverter performance and installation quality, such as cabling, could be influencing system efficiency. The discrepancies between arrays may not be entirely environmental but could also reflect differences in maintenance and system design.
Degradation analysis
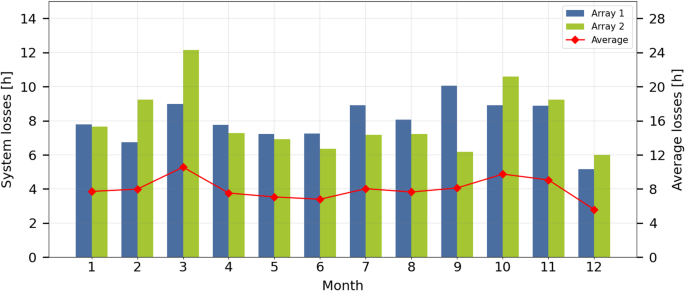
Figure 14 presents the yearly efficiencies for Array 1 and Array 2 from 2019 to 2022, demonstrating a clear decline in performance over time. In Fig. 14a, the yearly average efficiency of Array 1 decreases almost linearly from 2019 to 2021, followed by a sharp drop of −3.35% between 2021 and 2022. Similarly, as depicted in Fig. 14b, Array 2 shows a gradual decrease in efficiency from 2019 to 2022, with a notable decline of −3.68% between 2021 and 2022. The yearly efficiency values for both arrays over the four-year assessment period are provided in Table 4. The primary cause of the efficiency decrease is system aging, but other contributing factors, such as maintenance practices, UV exposure, and environmental conditions42. In this study, system aging emerged as the predominant factor contributing to the observed degradation. However, the role of maintenance, particularly regular cleaning and inspection, must not be overlooked. Inadequate maintenance can accelerate the degradation process, as dirt and debris accumulation on panels can reduce light absorption, further lowering system performance. Thus, the study highlights the importance of developing more effective maintenance strategies, especially in regions prone to high dust accumulation and humidity.
Figure 15a and Fig. 15b illustrate the relative degradation rates for both arrays, defined as the deviation in system efficiency from its 2019 baseline. Over the four-year assessment period, Array 1 exhibited an average annual degradation rate of 2.22%, while Array 2 showed a slightly higher rate of 2.54%. The more significant degradation in Array 2 can be attributed to material aging, which reduces the overall efficiency of the PV system. Over time, components such as encapsulants, glass, cells, and junction boxes experience a decline in their optical and mechanical properties42. The exposure of the arrays to environmental factors, such as fluctuating temperatures, irradiance levels, humidity, and physical stress, further accelerates degradation43,44.
Efficiency of both arrays during the four years of assessment.
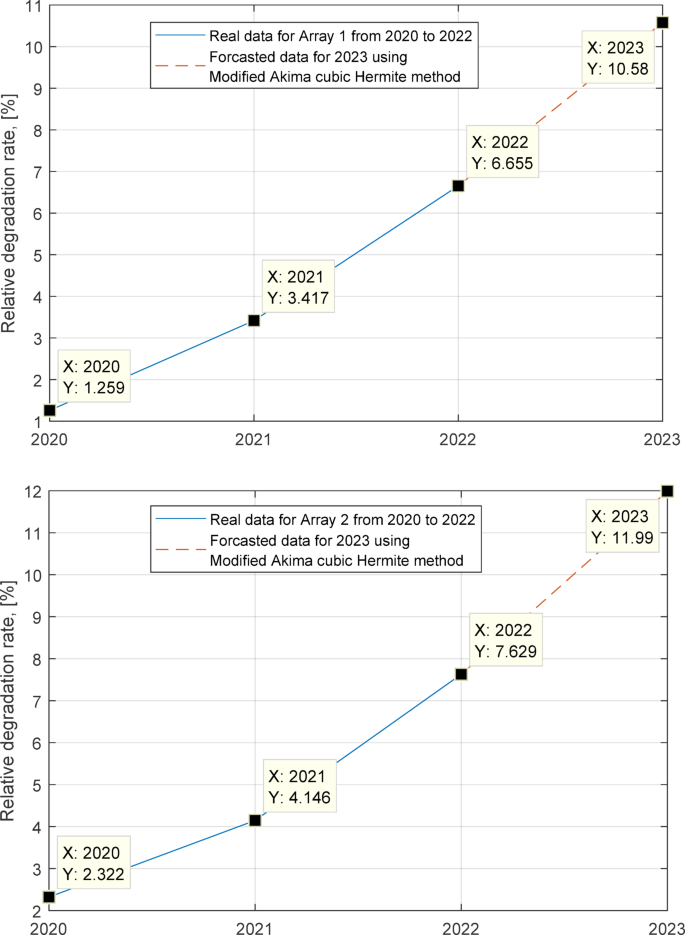
(a) Relative degradation and forecasted data in Array 1. (b) Relative degradation and forecasted data in Array 2.
An additional evaluation was performed to forecast the relative degradation rate for 2023 using the MAKIMA method. The forecast predicted a degradation rate of 10.58% for Array 1 and approximately 12% for Array 2. These predicted degradation rates suggest that the efficiencies of both PV systems could decrease by 9.94% for Array 1 and 5.31% for Array 2. The MAKIMA method was also assessed for forecasting accuracy using performance errors such as RMSE, MSE, MAE, and MAPE. The RMSE for Array 1 was 0.011, the MAE was 0.016, and the MAPE was 0.78%, while for Array 2, the RMSE was 0.013, the MAE was 0.01, and the MAPE was 0.35%. These results demonstrate that the MAKIMA method is highly effective for short-term forecasting, with predicted values closely aligning with actual data.
The degradation of PV modules represents a significant challenge for the solar energy industry, influencing material selection, manufacturing processes, and equipment aging45. The NREL reports an average degradation rate of less than 1% per year for PV panels. However, in warmer climates and rooftop installations, degradation rates can exceed − 9.55% to −0.4% per year46. Some studies also report an average degradation rate of −0.3% per year across multiple modules47. These increased degradation rates in tropical climates, such as Malaysia’s, can significantly reduce the power output and lifespan of PV modules. This poses a challenge for the long-term reliability and efficiency of PV systems, potentially hindering the widespread adoption of solar energy, particularly in regions with harsh climatic conditions. By focusing on these areas, the solar industry can work toward enhancing the reliability and performance of PV systems, reducing degradation rates, and improving their long-term sustainability.
Comprehensive discussion
A comparative analysis was conducted on the performance of PEARL’s system, which incorporates two distinct PV technologies: Poly-crystalline (Array 1) and Mono-crystalline (Array 2). The results indicate that Array 1 consistently outperformed Array 2 across all evaluation metrics. Solar irradiation and humidity were identified as significant factors influencing the performance of these systems. The primary findings are presented in Table 5, along with descriptions from previous literature for comparison with the present study underscores notable disparities in the operational outcomes of PV systems across different geographic conditions.
Systems studied by Ghazali et al.16, Saleheen et al.17, and Raghoebarsing et al.48 demonstrated higher YF, ranging from 3.68 to 3.70, in contrast to the PEARL system’s YF of 1.87. Similarly, array and system efficiencies reported in prior studies, particularly Raghoebarsing et al.48 (11.90% array efficiency, 97.20% system efficiency) and Ghazali et al.16 (12.52% array efficiency), significantly exceeded those achieved by the PEARL installation (3.07% and 1.72%, respectively). These differences can be attributed to multiple factors, including more stable solar irradiance profiles, larger system capacities, and potentially superior maintenance regimes. Furthermore, inverter efficiencies approaching or exceeding 96% were recorded in Raghoebarsing et al.48 and Luna Carlosama et al.49, whereas the PEARL system’s inverter efficiency was moderately lower at 91.08%, likely reflecting technological and operational constraints inherent to small-scale or older PV installations.
Despite the lower performance metrics in yield, efficiency, and CF (6.40% for the PEARL system), a notable strength lines in the PR. The PEARL system achieved a PR of 86.74%, outperforming many systems installed in other regions studied by de Lima et al.20, Saxene et al.22 and Sekyere et al.25, with theoretically Malaysia is more favorable in solar resources. This high PR indicates a remarkably efficient internal system operation relative to the available solar input, even under the challenging climatic conditions of Kuala Lumpur, characterized by high humidity, frequent rainfall, and heavy cloud cover during the monsoon period. The findings reveal that while absolute energy yields and efficiency indicators are important, they do not necessarily reflect the intrinsic quality or optimization of PV system performance in all environments. In this context, the PEARL system’s superior PR highlights its operational resilience, effective system integration, and minimal internal losses.
Therefore, although the PEARL system did not achieve outstanding results in conventional performance indicators, its exceptional PR firmly establishes its competitive advantage within the tropical PV sector. These results emphasize the critical need for performance evaluations to consider PR alongside absolute metrics, particularly when assessing PV system viability in regions subject to significant climatic variability. The present study thus contributes a nuanced understanding of system behavior, providing valuable insights for future deployments in similar tropical settings.