Record U.S Natural Gas Exports Have Bearish Implications for Petroleum
Petroleum prices under pressure
ULSD futures backwardation in decline; RBOB futures in contango
Natural gas price rallies may become more common
Sincerely,
Elaine Levin
President
Powerhouse
(202) 333-5380
The Matrix
Petroleum prices are under pressure. Negotiations to end the war in Ukraine are ongoing, with President Trump stating that we are “closer than ever” to a resolution. Adding to the bearish sentiment are reports of a buildup in floating crude oil storage. Even concerns of increasing military tensions in Venezuela have done little to change the trajectory of prices.
Along with the outright price falling, futures curves are flattening. Of particular interest is the relationship between futures months in ULSD. Last month, the 1st/2nd month spread was backwardated by up to $0.0850. At writing, the January 2026 future is just $0.0075 above the February 2026 future. This collapse in backwardation is occurring amid a chilly start to winter.
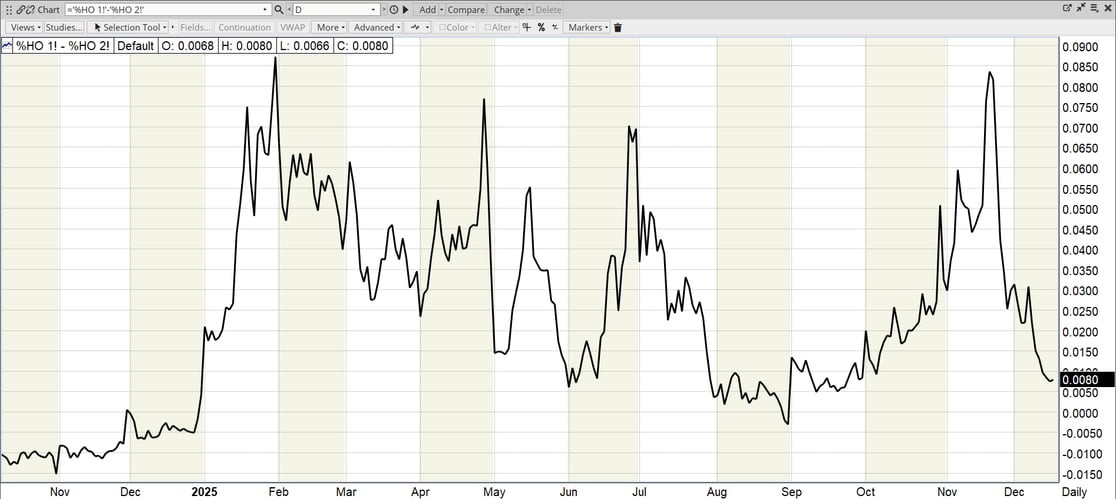
Chart Title: Continuation Chart of 1st-2nd Month ULSD Futures. Source: IceConnect
Following the invasion of Ukraine in 2022, market participants feared that if Europe could not replace Russian natural gas, diesel demand would grow as a critical backup fuel for power generation. This year, that fear has subsided. Despite cold weather and below-average storage levels, European gas prices are tumbling. The primary driver is a surge of US LNG flows into the market, fundamentally reshaping the global energy balance.
The price difference between European and US natural gas has narrowed sharply as the United States ramps up exports. According to Kpler data, US cargoes have accounted for approximately 56% of Europe’s LNG imports this year. This concentration has also been enabled by softening demand in Asia, where the Wall Street Journal reports that China’s economic momentum slowed broadly in November. With the Asian pull weakening, Europe has emerged as the primary destination for robust US export capacity.
Domestically, the supply picture shifted as well. Throughout the fall, ULSD crack spreads were exceptionally high—topping $50 in November. This surge was driven by tight global supply conditions, new sanctions on Russia’s oil sector, and refinery outages. Elevated distillate cracks incentivized refiners to maximize output as the autumn maintenance season concluded.
The ripple effects are visible in the gasoline market. Because refiners cannot produce diesel without also producing gasoline, the push for distillate has created an oversupply of RBOB during a seasonally slower-demand period. The supply overhang has pushed RBOB futures into contango for the first five months of the curve. As we approach the end of the year, a flip into contango in ULSD would be a gift to those with the capacity to store or ship product.
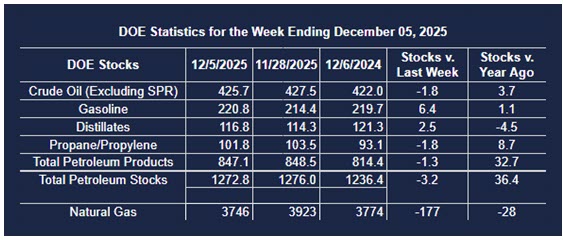
Supply/Demand Balances
Supply/demand data in the United States for the week ending December 5, 2025, were released by the Energy Information Administration.
Total commercial stocks of petroleum decreased (⬇) 3.2 million barrels to 1.2728 billion barrels during the week ending December 5th, 2025.
Commercial crude oil supplies in the United States were lower (⬇) by 1.8 million barrels from the previous report week to 425.7 million barrels.
Crude oil inventory changes by PAD District:
PADD 1: Down (⬇) 0.6 million barrels to 7.9 million barrels
PADD 2: Up (⬆) 1.0 million barrels to 102.0 million barrels
PADD 3: Down (⬇) 3.7 million barrels to 242.8 million barrels
PADD 4: Up (⬆) 0.1 million barrels to 25.1 million barrels
PADD 5: Up (⬆) 1.3 million barrels to 47.8 million barrels
Cushing, Oklahoma, inventories inventories were up (⬆) 0.3 million barrels to 21.6 million barrels.
Domestic crude oil production increased (⬆) 38,000 barrels per day from the previous report to 13.853 million barrels per day.
Crude oil imports averaged 6.589 million barrels per day, a daily increase (⬆) of 609,000 barrels. Exports increased (⬆) 396,000 barrels daily to 4.009 million barrels per day.
Refineries used 94.5 percent of capacity; an increase (⬆) of 0.4 percent from the previous report week.
Crude oil inputs to refineries decreased (⬇) 16,000 barrels daily; there were 16.860 million barrels per day of crude oil run to facilities. Gross inputs, which include blending stocks, increased (⬆) 64,000 barrels daily to 17.152 million barrels daily.
Total petroleum product inventories decreased (⬇) by 1.4 million barrels from the previous report week, down to 847.1 million barrels.
Total product demand increased (⬆) 893,000 barrels daily to 21.082 million barrels per day.
Gasoline stocks increased (⬆) 6.4 million barrels from the previous report week; total stocks are 220.8 million barrels.
Demand for gasoline increased (⬆) 130,000 barrels per day to 8.456 million barrels per day.
Distillate fuel oil stocks increased (⬆) 2.5 million barrels from the previous report week; distillate stocks are at 116.8 million barrels. EIA reported national distillate demand at 4.158 million barrels per day during the report week, an increase (⬆) of 728,000 barrels daily.
Propane stocks fell (⬇) by 1.8 million barrels to 101.8 million barrels. The report estimated current demand at 1,186,000 barrels per day, an increase (⬆) of 42,000 barrels daily from the previous report week.
Natural Gas
Natural gas prices recently surged to a three-year high of $5.496 per MMBtu, driven by extended below-normal temperatures across the US. However, a forecast calling for a warm-up by the end of December has allowed prices to retreat from those highs.
While weather remains the primary short-term driver, the underlying landscape is changing fast. LNG shipments have risen to record levels this year, and significant export capacity expansion is planned for 2026. Simultaneously, additional demand for AI gas-fired generation is coming online, tightening the long-term supply/demand balance.
As this new demand builds, the December price spike—despite the recent pullback—may well be a preview of things to come.
According to the EIA:
Net withdrawals from storage totaled 177 Bcf for the week ending December 5, compared with the five-year (2020–24) average net withdrawals of 89 Bcf and last year’s net withdrawals of 167 Bcf during the same week. Working natural gas stocks totaled 3,746 Bcf, which is 103 Bcf (3%) more than the five-year average and 28 Bcf (1%) lower than last year at this time.
Was this helpful? We’d like your feedback.
Please respond to [email protected]
This material has been prepared by a sales or trading employee or agent of Powerhouse Brokers, LLC and is, or is in the nature of, a solicitation. This material is not a research report prepared by Powerhouse Brokers, LLC. By accepting this communication, you agree that you are an experienced user of the futures markets, capable of making independent trading decisions, and agree that you are not, and will not, rely solely on this communication in making trading decisions.
DISTRIBUTION IN SOME JURISDICTIONS MAY BE PROHIBITED OR RESTRICTED BY LAW. PERSONS IN POSSESSION OF THIS COMMUNICATION INDIRECTLY SHOULD INFORM THEMSELVES ABOUT AND OBSERVE ANY SUCH PROHIBITION OR RESTRICTIONS. TO THE EXTENT THAT YOU HAVE RECEIVED THIS COMMUNICATION INDIRECTLY AND SOLICITATIONS ARE PROHIBITED IN YOUR JURISDICTION WITHOUT REGISTRATION, THE MARKET COMMENTARY IN THIS COMMUNICATION SHOULD NOT BE CONSIDERED A SOLICITATION.
The risk of loss in trading futures and/or options is substantial and each investor and/or trader must consider whether this is a suitable investment. Past performance, whether actual or indicated by simulated historical tests of strategies, is not indicative of future results. Trading advice is based on information taken from trades and statistical services and other sources that Powerhouse Brokers, LLC believes are reliable. We do not guarantee that such information is accurate or complete and it should not be relied upon as such. Trading advice reflects our good faith judgment at a specific time and is subject to change without notice. There is no guarantee that the advice we give will result in profitable trades.
Copyright 2025 Powerhouse Brokers, LLC, All rights reserved