![[OC] Popular vote vs electoral college 1980-2024](https://www.europesays.com/wp-content/uploads/2025/12/jv33z30l5z7g1-1920x1024.png)
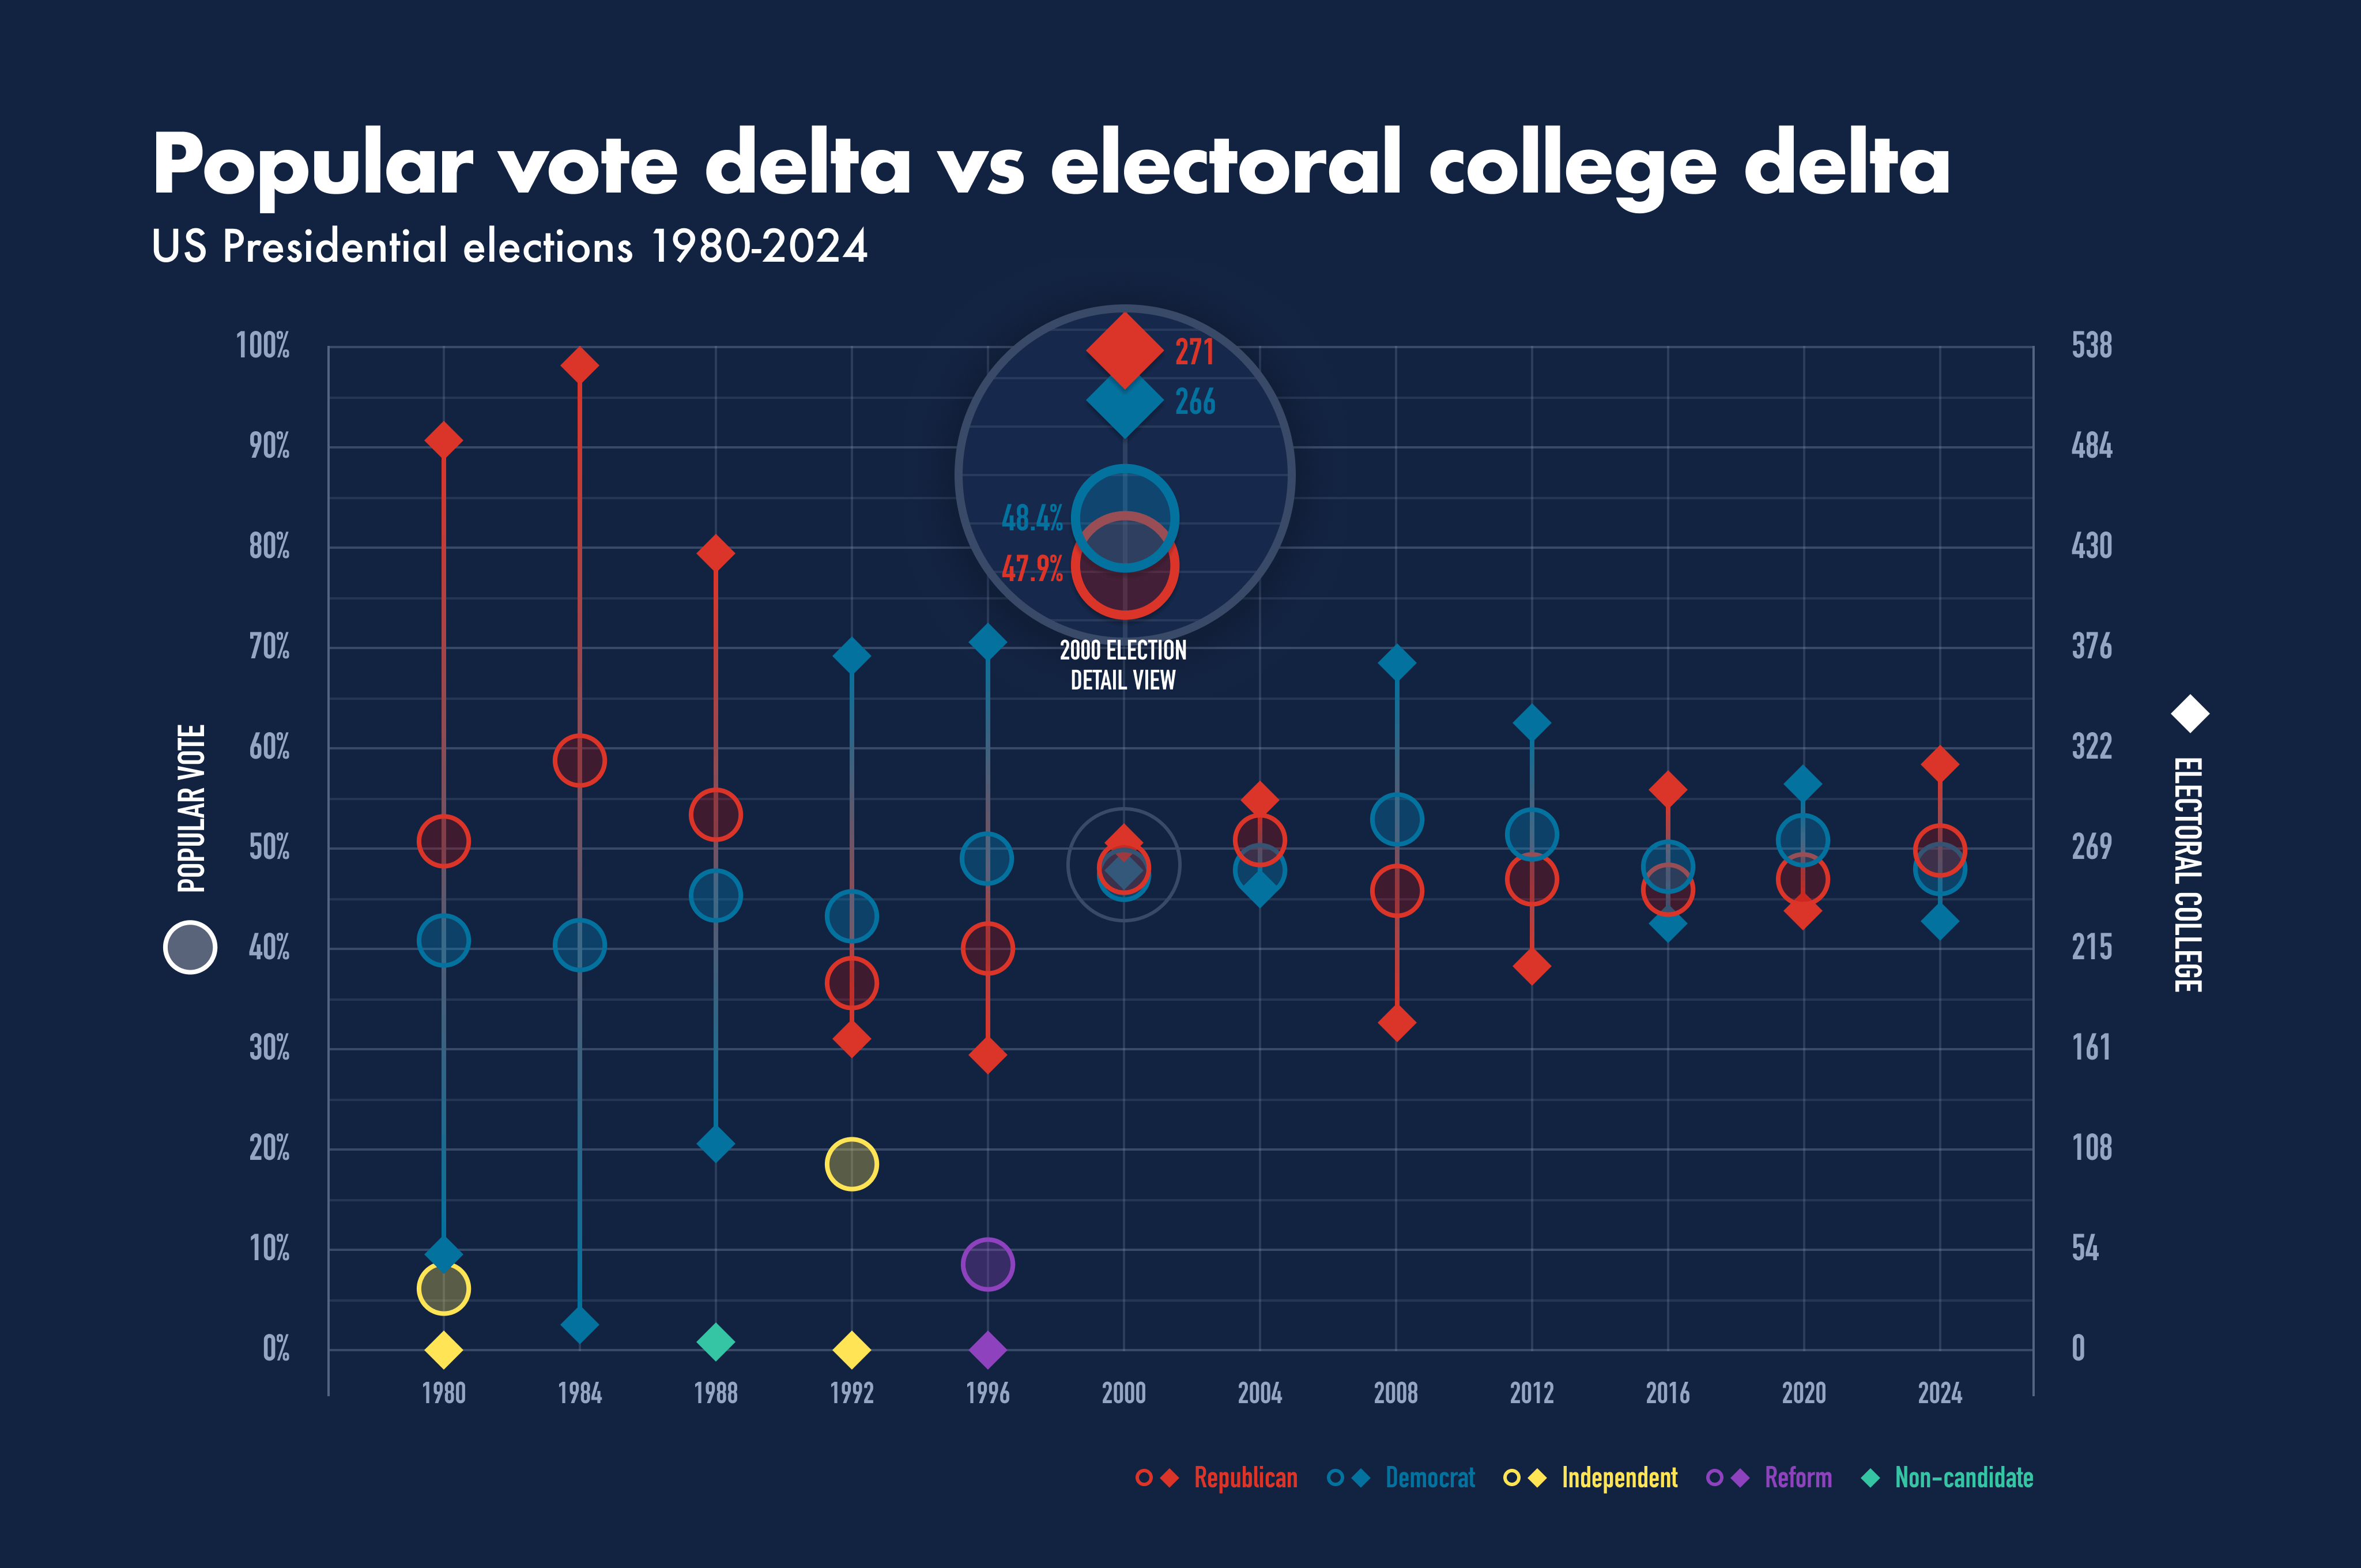
This shows how the delta in the popular vote relates to the delta in the electoral college for elections going back to 1980. It's interesting to me to see that the greatest split in the popular vote has only been 18.2% (the 1984 blowout) and typically stays around 5%, while the electoral college can show a much wider spread.
I added in third-party candidates where they received enough of the vote to be relevant.
Interesting trivia:
* In 1988, Bentsen, who was running as VP with Dukakis, got one electoral college vote from a WV elector
* Ross Perot got 18.9% of the popular vote in 1992 as an Independent, and then got 8.4% in 1996 after getting into the race late in 1996 under the Reform party
* In 2016 there were 7 faithless electors, 5 D and 2 R, so the EC total is only 531
Posted by randomusername3OOO
15 comments
This shows how the delta in the popular vote relates to the delta in the electoral college for elections going back to 1980. It’s interesting to me to see that the greatest split in the popular vote has only been 18.2 ppt (the 1984 blowout) and typically stays around 5%, while the electoral college can show a much wider spread.
I added in third-party candidates where they received enough of the vote to be relevant.
Source: Wikipedia
Tools: Google Sheets, Figma
I always find it interesting and annoying that not only does the electoral college dismantle the will of the people on occasion, but it is also a really bad predictor of the votes. I mean obviously it would make the percentages more rigid but it makes it look so much more dramatic than needed.
Well done. It took me a second, but I was able to interpret the the data on each axis (because I actually looked at the legend symbols on each side ¤Öé and then everything clicked.
One small improvement suggestion is to somehow denote the 270 Electoral College votes needed to win. Could be a note on the axis legend, or maybe a line across the chart.
This is really nice looking. A+, OP
So 2016 was the only year since 1980 where pop vote and electoral college were flipped
edit: and 2000. The others before 1980 are 1888, 1876 and 1824
not to be a pedant, but my understanding of the word “delta” is that it means “difference”. so, you aren’t showing the difference between the popular vote each candidate got vs the difference in the EC they got directly, youre showing the amount they each got relative to the total.
eg, if it were the delta, for 1980 the difference in the popular vote looks to be around 10 percentage points, but the difference in the EC result is around 80 percentage points. maybe this could be shown with a coloured bar graph?
that being said, you are showing data beautifully, so good job on that.
Very nice. One note: you have the circles flipped in the 2000 election (the part that isnŌĆÖt zoomed in)
wow people really became stupid in 2024
What is unexpected and kind of crazy is that we came pretty close to Trump winning the popular vote and Kamala winning the Electoral College this past election
While I would eliminate the EC or at least dramatically reform it, this does an excellent job of demonstrating the purpose of the EC. We have an extremely large democracy, but even when we were much smaller, it was difficult to get people to accept yielding some of their power to a majority of people who may live elsewhere. The EC is a compromise that requires the winner to have breadth of appeal, not just 50%+1 voteŌĆöand of course still be chosen by the people. In some aspects it is ŌĆ£undemocraticŌĆØ because it allows one personŌĆÖs vote to count more than anotherŌĆÖs, but what good is a democracy when you donŌĆÖt have wide geographic appeal? If everyone from Florida to Idaho feels like they are getting shafted every election, then that increases the risk of the union falling. Personally, I would account for that in Congress, but the founding fathers had to figure out a way to get everyone to unite, when the Articles of Confederation were faltering. Right now, weŌĆÖve been on our second republic for 230+ years. Meanwhile, the French are on their fifth republic, not to mention a couple of empires in the middle, and far less land and population to appease.
Electoral votes for 16 & 24 aren’t correct even if there are only 7 more votes on that. Both totals went up more than that, especially for Trump. Interesting that going back to 1992 there is literally one election where the Republican got the majority (50%+1 vote).
why do you keep saying the word “Delta” when you mean the word “change”?
The biggest problem with this chart is that it compares something important (the popular vote margin) to something completely unimportant (the electoral vote margin). The narrowing gap between the electoral vote margin and the popular vote margin gives the false impression that the Electoral College is somehow becoming more representative of the country.
Winning the Electoral Collage by 200 votes is exactly the same as winning by 1 vote. The winner becomes the President. The popular vote margin says something important about an electoral mandate.
Organized money has really cracked the democracy problem. RIP human race.
Ironically I would cast a vote if either party wanted to make that vote count and eliminate the EC.┬Ā
Comments are closed.