![[OC] How Microsoft Turned $77.7B in Revenue into $27.7B Profit in Q1 FY26](https://www.europesays.com/wp-content/uploads/2025/12/t0o4z5ojqc8g1-1920x1024.png)
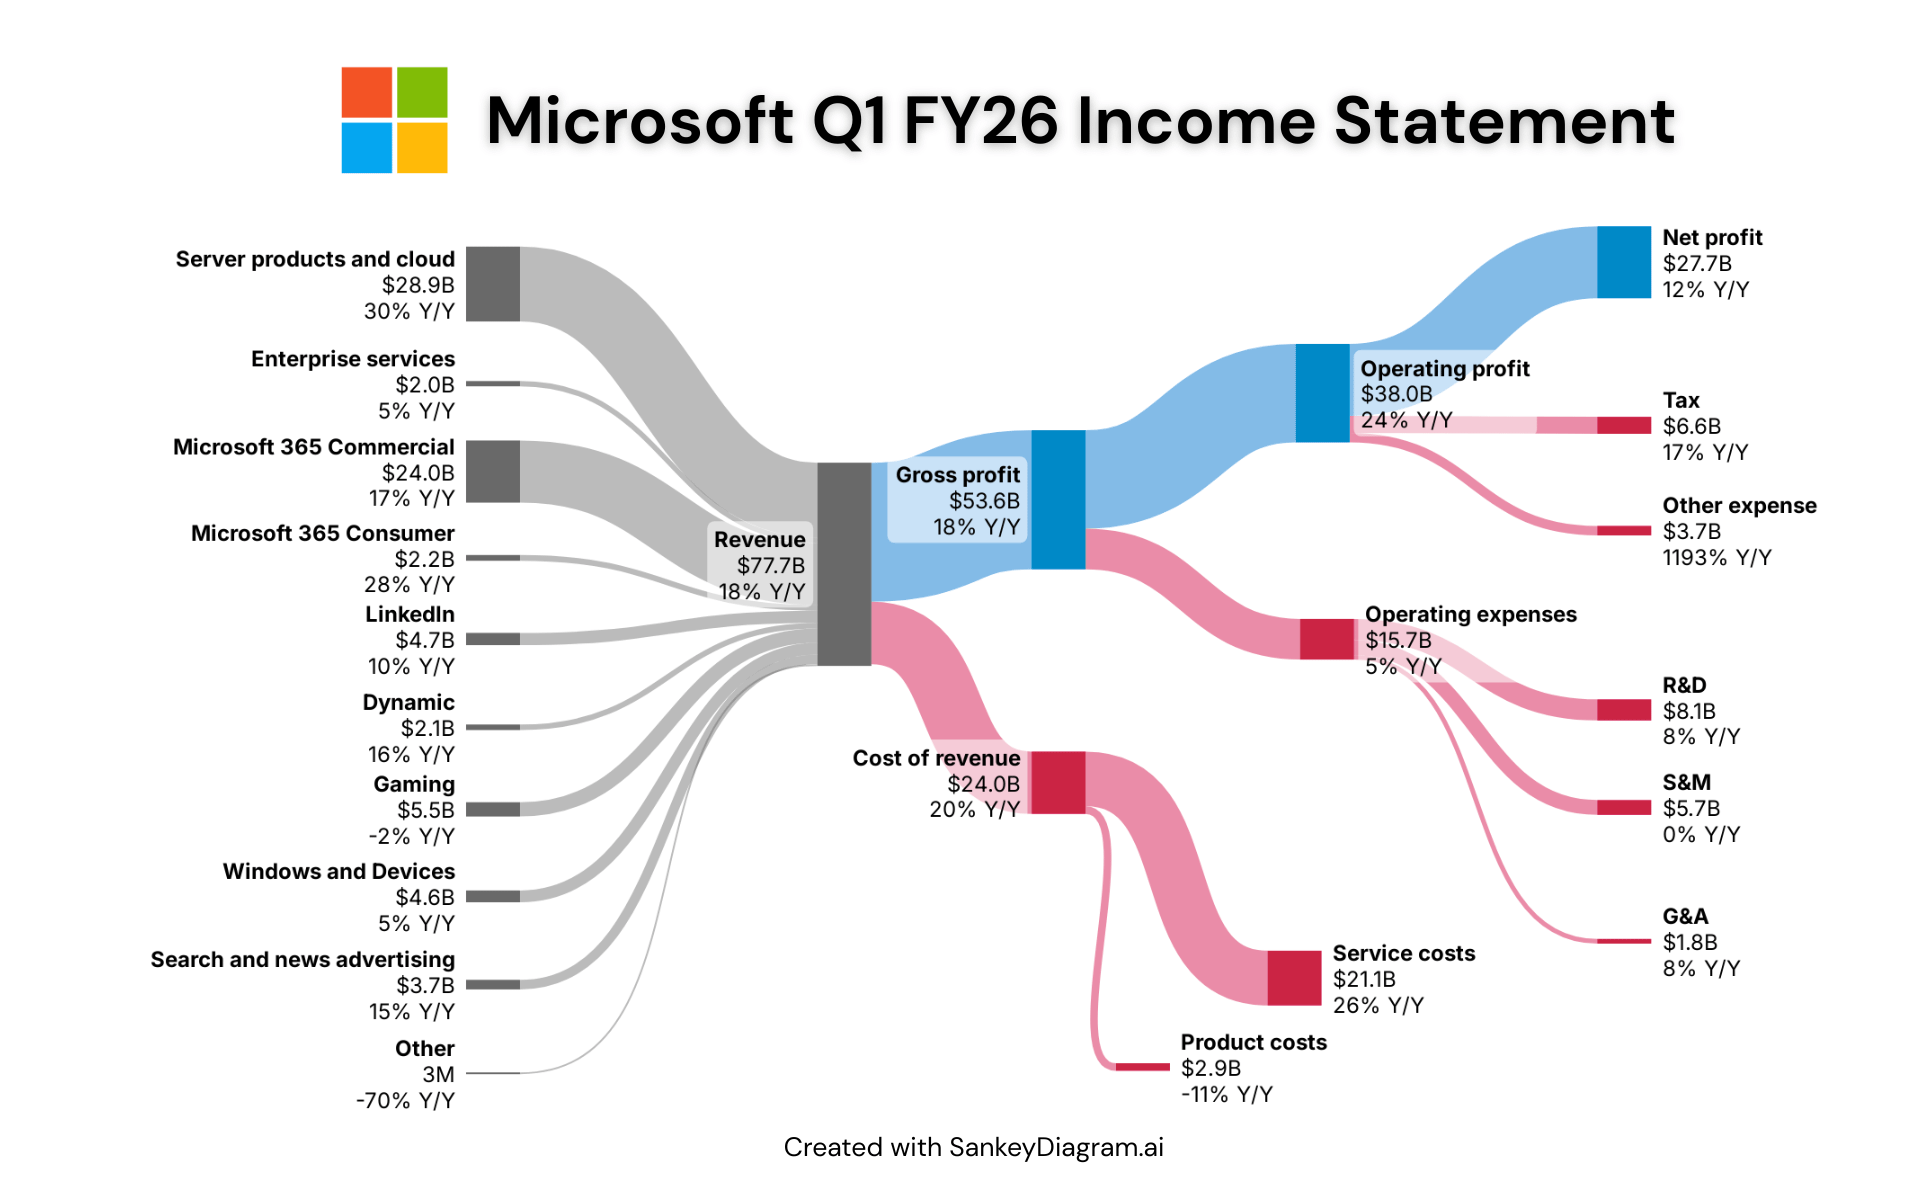
This Sankey diagram visualizes MicrosoftŌĆÖs Q1 FY26 income statement, showing how the company generated $77.7B in total revenue and how it flowed through costs and operating expenses to produce $27.7B in net profit.
Highlights from Q1 FY26:
- Server products and cloud services remain the largest revenue driver, growing 30% year over year
- Microsoft 365 Commercial and LinkedIn continue steady growth
- Gross profit reached $53.6B, up 18% YoY
- Operating profit increased to $38.0B, up 24% YoY
- Net profit rose 12% YoY, despite higher operating expenses
Made with: SankeyDiagram + Canva Tool
Source: Microsoft Q1 FY26 Earnings Report / Investor Relations
Posted by FrostingTall9171
17 comments
Which one shows how much Altman siphoned?
Weird how AI isn’t listed? I’d assume, given how important and awesome everyone says it is, that they would want is to know how much money it is making them.
How the hell does linkedin make 4.7B
For context, when the US government sued Microsoft for antitrust 30 years ago, it was for Microsoft’s dominance in operating systems (Windows) and applications (Office). They were roughly equal in size.
Today, the closest equivalents would be the “Windows and Devices” and “Microsoft 365” tranches. ***Everything else*** did not exist back then, or in very, very tiny slivers (such as gaming). Yes, that entire “Server products and cloud” tranche is entirely a product of the past 20 years.
NB – “Dynamics” is misspelled.
ItŌĆÖs beyond me how they could mess up the whole Gaming devision, they made huge investments and yet fumbles with the Xbox hardware and gaming studios.
$27B profit on $77B revenue, wow. What will be their excuse whe they fire another 8000 employees?
What is the synergy for Microsoft owning LinkedIn?
I would love to see similar for Apple
They have a monopoly within a few industries…durr.
It’s absolutely crazy how much MS has all the corpas by the balls with server, cloud and 365. Crazy!
Is it just me who thinks tech companies like this are making too much profits? Their margins are way higher than most(every) non-tech companies. I think it’s time these kinds of companies that are not governed by the usual supply demand curve to be taxed more. It’s this kind of market distortion that’s causing monopolistic behavior and income inequality.
$9 billion in Net Profit per month for 3 months.
hot damn.
and they are currently “only” the 4th biggest company in the world:
https://www.financecharts.com/screener/biggest?sort=marketcap-desc
I’m so tired of this sub getting dumped with a bunch of posts just dumping data in SankeyDiagram and more or less calling it a day.
Damn Azure is cooking. I guess MS Fabric will double that number
Didn’t they announce another price hike for office?
Can’t wait for next year to see Microsoft files for bankruptcy, since Steam is releasing the Steam machine and Linux is friendlier than ever, Microsoft is dead in the water. Or so I’m told by redditors.
I absolutely detest how people title these income statement graphs. They do not show how companies made their money. By aggregating all of the outgoings, they do basically the opposite of that. What would be interesting is seeing how much each department spent on each category.
Comments are closed.