In the global market, the US dollar remained under pressure following a significant decline throughout the year. Although it stabilized at around 97.9 on Friday, it still lingered near its lowest level since early October, with an accumulated annual loss of 9.7%, heading towards its worst annual performance since 2017.
The core driver behind this weak trend is the growing expectation in the market that the Federal Reserve will continue its interest rate cut cycle – a factor that directly lowers US Treasury yields, narrowing the premium advantage of high-interest-rate assets in the US compared to other major currencies, thus forming the main logic for the decline of the US Dollar Index. However, why does strong data reinforce the Fed’s rate cut expectations, while recent weaker data instead caused the dollar to rebound?
Core Driver: Policy Expectations Overriding Fundamental Signals
Dovish sentiment in monetary policy has become the dominant variable guiding the trading of the US Dollar Index. In a recent blog episode, Bessent mentioned that he wished to abolish the dot plot and reduce the size and role of the Federal Reserve, preventing the central bank from remaining the absolute protagonist on the economic stage.
 Despite evident divisions among Federal Reserve officials (with most expecting only one rate cut) and the fact that US economic data is not entirely weak – as growth remains resilient and several key macroeconomic indicators have exceeded expectations, with robust GDP data released on Tuesday further confirming this – the market pricing logic has shifted from being “fundamentals-driven” to being “policy-expectation-led.” This suggests that the independence of the Federal Reserve is teetering on the edge, with its increasing tendency to serve political purposes.
The employment data released on Wednesday reflected a mixed picture, further highlighting this characteristic: Initial jobless claims for the week ending December 20 fell to 214,000 (below the expected 224,000), showcasing labor market resilience; however, continuing claims rose to 1.923 million (above the forecast of 1.9 million), reflecting localized weakness.
This divergence has resulted in positive data triggering only brief and limited rebounds in the US Dollar Index, failing to alter its core downward trend. The weight of policy expectations now far outweighs fundamental performance. There is also another possibility: American-preferred metrics like CPI and GDP may not genuinely represent the resilience of the US economy but appear robust due to statistical formulas. Previous analyses have elaborated that the current state of the US economy likely involves rising inflation, coupled with economic contraction and increasing unemployment.
Interest Rate Differentials: Diverging Policies Across Countries Suppress Dollar Appeal
The inherent weakness of the US Dollar Index essentially stems from the significant divergence in monetary policy paths among major global economies, which directly reflects the interest rate differential logic in foreign exchange trading.
Market expectations indicate that by 2026, the Federal Reserve will have cumulatively cut rates by 50 basis points, while the Bank of Japan is anticipated to raise rates by 25 basis points, and the European Central Bank is likely to maintain its rates unchanged.
The reversal of such interest rate differential expectations has continued to suppress the appeal of the US dollar as a high-yield asset—even as other central banks simultaneously pursue easing policies, the dominant position of the US dollar in the global financial system makes the US interest rate trajectory the core anchor point for market pricing. The narrowing interest rate differential directly translates into downward pressure on the US Dollar Index.
In the Asian currency market, this trend is even more pronounced: the US dollar shows a pattern of mild depreciation against currencies like the Indonesian rupiah amid fluctuations.
Although the contraction in market liquidity triggered by the Christmas holiday suppressed extreme volatility, relatively positive risk appetite and interest rate differentials have jointly supported regional currencies. In the absence of major global black swan events, the depreciation pressure on the US dollar in this region exhibits persistence, further weighing on the performance of the US Dollar Index.
Additional Variables: Dual Impact of Liquidity and Policy Risks
Beyond the core interest rate differential logic, two key variables have further intensified the downward pressure on the US Dollar Index. First, the Federal Reserve’s short-term Treasury purchase program of $40 billion per month initiated in mid-December has been continuously injecting liquidity into the financial system. The abundant supply of US dollars has directly lowered exchange rate valuations, with this signal of liquidity easing resonating with interest rate cut expectations.
Second, market concerns over Trump’s administration potentially appointing a dovish Federal Reserve Chair have risen—Trump has indicated that he will finalize the selection of a new chair in early 2026. Kevin Hassett, cited by Bloomberg as a leading candidate, is considered by the market to pose a long-term negative impact on the US dollar due to his dovish stance.
Additionally, the aggressive tariff policies implemented by Trump since the beginning of the year, along with his direct threats to the independence of the Federal Reserve, have significantly weakened market confidence in the US dollar. Coupled with the recent escalation of geopolitical tensions driving safe-haven buying of precious metals, the strengthening of assets such as gold has further diverted demand for the US dollar, creating multiple pressures on the US Dollar Index.
Summary and Technical Analysis:
Currently, various factors are pointing to a decline in the US dollar, but the foreign exchange market is extremely sensitive, with capital already betting on almost all negative factors. Thus, the US dollar has not reached new highs despite the increase in bearish factors and may even be brewing a rebound.
It can be observed that during the rapid rise of gold, silver, and copper to new highs, the US dollar did not fall. One interpretation is that the US dollar may already be preparing for a move reflecting ‘all bad news priced in’ before any new bearish developments emerge. Another possibility is that precious metals are genuinely in short supply, meaning even if a rebound in the US dollar drives prices higher, it cannot suppress the influx of buying. It is also possible that the premiums in the over-the-counter secondary markets of ETFs, such as those tracking silver and gold, have become excessively inflated recently, forcing traders to sell ETFs and buy futures to capture profits.
The daily chart of the US Dollar Index shows that after breaking lower, the dollar attempted to rebound into a reversal pattern. However, the formation was interrupted by cross-currency selling pressure, and the pattern remains incomplete. If the dollar fails to quickly reclaim the 98.00 level in the near term, it may continue to decline, with support levels at 97.50 and 97.00 respectively.
If the US dollar rebounds, resistance levels will be near the lower boundary of the range at approximately 98.10 and around 98.63.
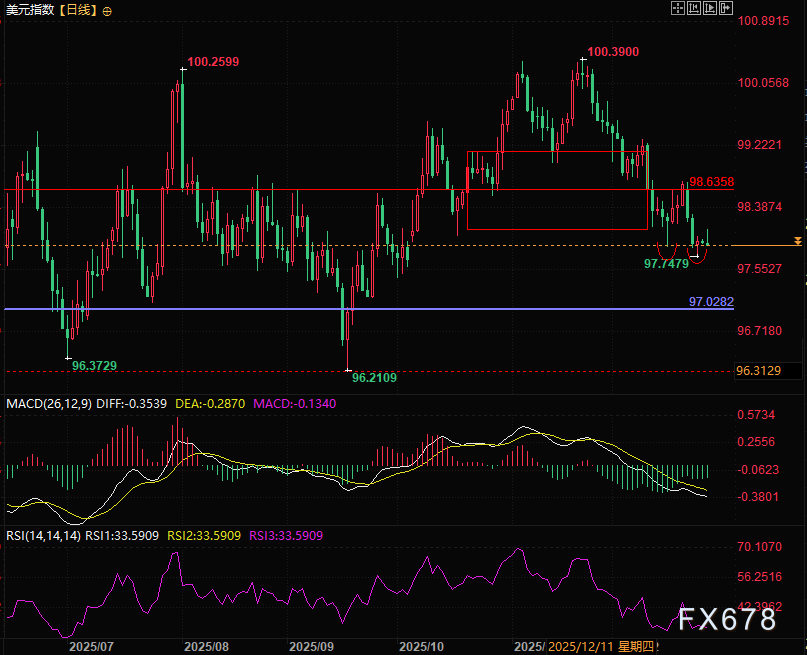
(Daily chart of the US Dollar Index, Source: YiHuiTong)
As of 21:45 Beijing time, the US Dollar Index is currently quoted at 97.86.