
The USD/CAD pair attracts buyers for the sixth straight day on Friday and climbs back closer to its highest level since December 5 during the first half of the European session. The momentum is sponsored by an extension of a two-week-old US Dollar (USD) rally and the lack of buying around Crude Oil prices, which tends to undermine the commodity-linked Loonie. Bulls now await a sustained strength beyond the technically significant 100-day Simple Moving Average (SMA) before placing fresh bets as the focus remains glued to the monthly employment details from the US and Canada.
The popularly known Nonfarm Payrolls (NFP) report is expected to show that the US economy added 60K new jobs in December, down from 64K in the previous month. Meanwhile, the Unemployment Rate is seen edging lower from 4.6% in November to 4.5%. Apart from this, Average Hourly Earnings will offer more cues about the US Federal Reserve’s (Fed) rate-cut path, which, in turn, plays a key role in influencing the near-term USD price dynamics and overshadowing Canadian jobs data. Nevertheless, the crucial data should provide a fresh directional impetus to the USD/CAD pair later today.
Heading into the key data risks, heightened geopolitical uncertainties on the back of the US incursion in Venezuela, China-Japan rift, and the protracted Russia-Ukraine war continue to benefit the USD’s safe-haven status and support the USD/CAD pair. In a wide-ranging interview with The New York Times on Wednesday, President Donald Trump said that he expected the US would be running Venezuela and extracting oil from its huge reserves for years. Adding to this, China escalated a diplomatic spat with Japan and has begun restricting exports of rare earths and rare-earth magnets to Japan.
Meanwhile, a WSJ report said that Trump is planning an initiative to control the Venezuelan oil industry for several years, in a bid to achieve the $50 a barrel price target. The report further added that the Trump administration is considering controlling Venezuela’s state-run oil company, Petróleos de Venezuela SA, or PdVSA. This reaffirms expectations that the US control of Venezuela’s oil was likely to increase global supplies and fail to assist the black liquid to build on the previous day’s gains. This, in turn, undermines the Canadian Dollar (CAD) and also lends support to the USD/CAD pair.
USD/CAD daily chart
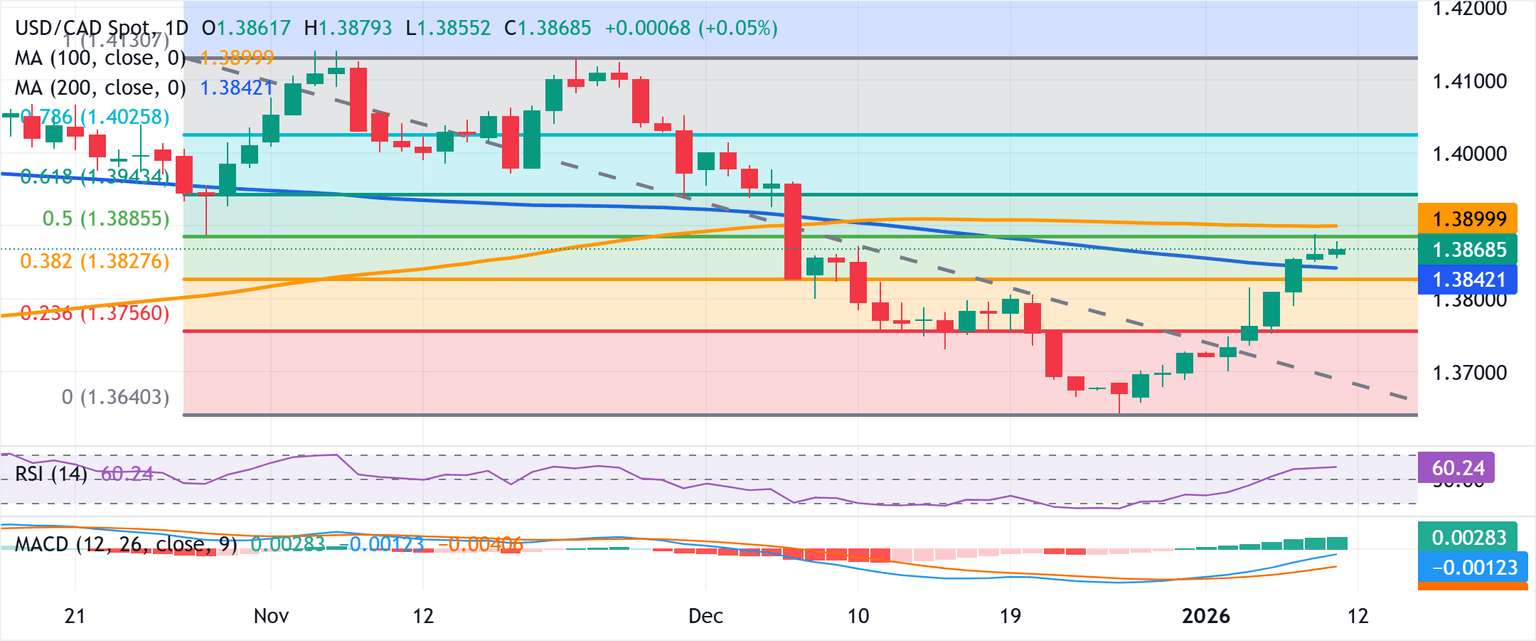
Technical outlook
This week’s breakout through the very important 200-day SMA could be seen as a key trigger for bullish traders. That said, it will still be prudent to wait for some follow-through strength beyond the 100-day SMA barrier, around the 1.3900 mark, which coincides with the 50% Fibonacci retracement level of the November-December downfall, before placing fresh bets. The USD/CAD pair holds between these longer averages, with the former offering underlying support and the latter capping the topside.
The Moving Average Convergence Divergence (MACD) histogram has turned positive and is expanding, indicating the MACD line stands above the Signal line and momentum is improving near the zero mark. The Relative Strength Index (RSI) sits at 61, showing firm bullish bias without overbought conditions. The technical setup supports an upside bias, but a decisive close through the 50% retracement would be needed to extend toward the 61.8% area, while failure to break would keep the range intact.
(The technical analysis of this story was written with the help of an AI tool)