Data extracted in November 2025
Planned article update: December 2026
Highlights
In 2024, non-financial corporations in the EU had a profit share of 40.1% and an investment rate of 22.1%.
In 2024, profit shares of non-financial corporations varied among EU countries from 32.2% in France to 74.9% in Ireland.
In 2024, the investment rate of non-financial corporations varied among EU countries from 15.9% in Luxembourg to 28.5% in Hungary.
Source: Eurostat (nasa_10 _nf_tr)
Overview
This article focuses on the distribution of profit, investment and their components among EU non-financial corporations (businesses whose main economic activity is non-financial). Economic developments in production, income generation and (re)distribution, consumption and investment may be better understood when analysed by institutional sector. The non-financial corporations sector comprises all private and public corporate enterprises that produce goods or provide non-financial services to the market.
This article presents Eurostat statistics derived from European sector accounts, which form part of the European system of national and regional accounts (ESA 2010). Data are provided for the EU and the euro area. Most indicators are presented in relation to gross value added. This standardisation helps make spatial comparisons between countries of different sizes.
Profit shares: distribution of value added
Value added is the value generated by the production account. Figure 1 shows that most of the value added of non-financial corporations is used to compensate the supply of labour and capital, referred to as the compensation of employees and gross operating surplus in national accounts. Gross operating surplus is a measure of profit (before taxes on income and wealth) and may include the remuneration of self-employed people in countries that include them in the non-financial corporations sector (rather than the household sector). A small part of value added is used to pay taxes on production (less subsidies).
The profit share of non-financial corporations is the gross operating surplus divided by gross value added. This indicator shows the proportion of non-financial corporations’ value added during the production process that remunerates the supply of capital (or pays income and wealth taxes). Different profit shares in different economies can be explained by a number of factors, such as the relative importance of labour or capital-intensive industries, labour productivity and labour costs.
In 2024, profit shares were slightly higher in the EU (40.1%) than in the euro area (39.7%). Among the EU’s 4 largest economies, Italy (43.8%) had the highest profit share for non-financial corporations in 2024, the only one above the EU average. The profit shares in Spain (39.0%), Germany (37.2%) and France (32.2%) were all relatively low. In fact, the profit share in France was the lowest recorded among all EU countries.
In 2 EU countries, the gross operating surplus of non-financial corporations represented more than half of the gross value added during the production process: 74.9% in Ireland and 56.5% in Malta. Ireland’s high share can be attributed to large foreign-owned multinational companies located in the country that have a high capital intensity.
Profit shares between 2014 and 2024
Between 2014 and 2024, the profit share of non-financial corporations in the EU remained stable, hovering around 40%. From 2014 to 2018, in the EU’s 4 largest countries, there were minor declines in Germany and Spain, while France remained stable, and Italy reported comparatively high levels. In 2019 and 2020, the profit share of non-financial corporations in Spain decreased, France remained broadly stable, and Italy continued to record high levels. During the post-pandemic period (2021-2023), both the EU and the 4 largest countries experienced temporary increases, followed by a decline in 2024, with the largest reductions observed in Germany and Italy.
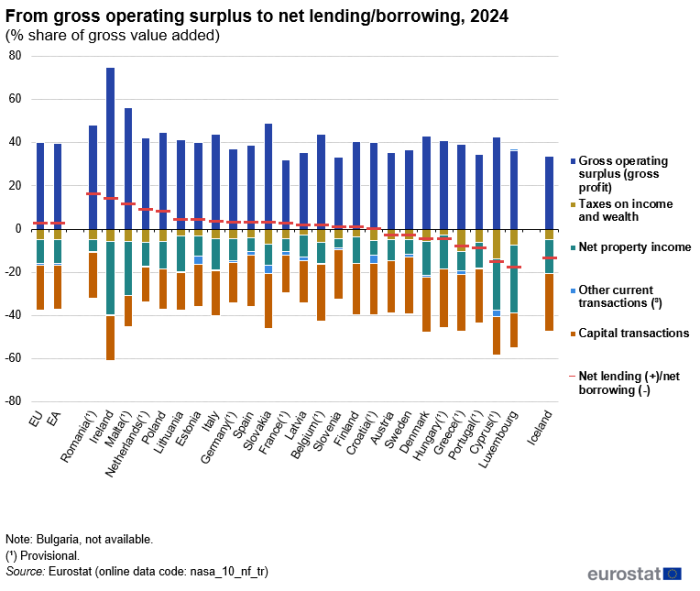
From gross operating surplus to net lending/borrowing
The gross operating surplus of non-financial corporations is mainly used to pay taxes on income and wealth and to remunerate capital, for example, in the form of interest or dividends paid to shareholders. In addition, non-financial corporations receive interest and other property income from their financial investments, for example, in the form of dividends or reinvested earnings. After accounting for these payments and income as well as other miscellaneous current transfers, the remaining gross operating surplus becomes the savings of non-financial corporations. These savings may be used, for example, for investments, other capital transactions, or loans; if the investment and other capital transactions exceed savings, the corporations may need to borrow.
Figure 3 shows non-financial corporations’ gross operating surplus, how it is distributed, and the resulting net lending (for a positive surplus) or net borrowing (for a negative surplus). In 2024, total net distributive transactions (taxes, interest, other property income/expenditure, other current transactions and capital transactions) in the EU represented -37.7% of value added.

Source: Eurostat (nasa_10_nf_tr)
Among EU countries, the share of total net distributive transactions by non-financial corporations in 2024 was largest in Ireland (-61.1%) and lowest in Romania (-32.0%).
Aside from capital transactions, when looking at different types of current distributive transactions, the largest share for non-financial corporations in 2024 was generally net property income. In the EU, net property income was equivalent to -11.0% of value added, accounting for nearly two thirds of all net current distributions (taxes on income and wealth, net property income and other current transactions).
Taxes on income and wealth were equivalent to -4.9% of non-financial corporations’ value added in the EU. Cyprus recorded the largest ratio of taxes on income and wealth to value added among all of the EU countries, at -14.0%, followed by Greece (-10.4%). The ratio of taxes on income and wealth to value added was smaller than -3.5% of value added in the 3 Baltic countries and Hungary.
Non-financial corporations’ savings and net borrowing (or lending) are used to finance gross capital formation, other capital transfers and acquisitions less disposals of non-financial non-produced assets. Gross capital formation includes gross fixed capital formation (referred to elsewhere in this article as investment), changes in inventories, and acquisitions less disposals of valuables. Non-financial non-produced assets include land, mineral reserves or radio spectra.
The difference between savings and all capital transactions is called net lending net borrowing, depending on whether it is positive or negative. If non-financial corporations are net lenders, it means that they have an excess of savings over investment and other capital transactions that they can lend to other sectors of the national economy or to non residents. Conversely, they are net borrowers when they need to borrow money from other sectors to supplement their savings in order to finance their investments and other capital transactions.
In 2024, non-financial corporations in the EU were net lenders, with their net lending valued at 2.4% of the gross value added. Non-financial corporations of the 4 EU’s largest economies were also net lenders in 2024, above the EU average: Italy at 3.6%, Spain at 3.1%, Germany at 3.1% and France at 2.5%.
Investment rates
Investment is the largest part of capital transactions. The investment rate of non-financial corporations presented in Figures 4 shows investments in fixed assets (mainly machinery, equipment, buildings and intellectual property rights) as a percentage of value added in the production process.
In 2024, the investment rate was higher in the EU (22.1%) than in the euro area (21.5%).
Hungary reported the highest rate (28.5%) among all EU countries. Rates below 20.0% were reported in 7 EU countries, with the lowest rate in Luxembourg (15.9%).
Although Ireland’s investment rate was relatively low in 2024, it is usually very volatile and quite high (greatly influencing the overall EU rate). It peaked at 67.1% in 2019, due to the very large number of multinational companies in the country. In that same year, Ireland accounted for 9% of the total non-financial corporations gross fixed capital formation in the EU, even though it has just 1% of the EU population and 3% of GDP.
Investment rates between 2014 and 2024
Although annual investments may be volatile for individual corporations, cyclical trends can be observed at national level. Figure 6 shows investment rates from 2014-2024 in the EU and its 4 largest economies.
From 2014 to 2018, gross investment rates of non-financial corporations increased in the EU and in its 4 largest economies, except in Spain and France in 2015. Since 2019, the investment rate has risen in Spain and Germany, while France and Italy have recorded modest declines. Currently, among the 4 economies, the rate is highest in Spain (24.2%) and lowest in Germany (18.8%). France and Italy have rates of 21.7% and 22.1%, respectively.
Source data for tables and graphs
Data sources
The compilation of sector accounts follows the European system of accounts (ESA 2010).
The non-financial accounts
Non-financial accounts provide a systematic description of the different stages of the economic process: production, generation and distribution, use and accumulation of income. Each of the accounts ends with a balancing item: value added, operating surplus, primary income, disposable income, saving. For non-financial corporations, some of these can be seen as profit measures.
The data presented in this article do not take account of profits/losses caused by changes in the price levels of assets or by extraordinary events (such as catastrophic losses). Profit measures may be calculated either gross or net of depreciation (called consumption of fixed capital in national accounts): in this article all indicators are presented gross of the consumption of fixed capital.
The non-financial corporations sector
Institutional sectors in national accounts bring together economic units with broadly similar characteristics and behaviour. The non-financial corporations sector is 1 of 5 sectors that make up the domestic economy. The other sectors are financial corporations, general government, households and non-profit institutions serving households.
The non-financial corporations sector consists of institutional units that are independent legal entities and market producers whose principal activity is the production of goods and non-financial services.
Indicator definitions
The profit share of non-financial corporations is the gross operating surplus divided by gross value added. This profitability indicator shows the share of the value added created during the production process that is used to remunerate capital.
The gross investment rate of non-financial corporations measures investment in fixed assets (such as buildings, machinery, software and major improvements to fixed assets) to the value added created during the production process. The investment rate for the total economy and for individual institutional sectors is a key indicator for economic analysis and EU policymaking, in particular in the context of monitoring EU countries’ economies under the European Semester, for example, country specific recommendations / European Commission recommendations. The investment rate is also part of the principal European economic indicators (PEEIs).
Explore further
Thematic section Selected datasets Methodology External links Legislation