
Find out why Dow’s -24.8% return over the last year is lagging behind its peers.
Approach 1: Dow Dividend Discount Model (DDM) Analysis
The Dividend Discount Model looks at the cash you receive as a shareholder through dividends and asks what those payments are worth today, after factoring in how fast they might grow or shrink over time.
For Dow, the model uses an annual dividend per share of about $1.39 and an estimated return on equity of 6.41%. The payout ratio is around 151.19%, which means the company is paying out more in dividends than it is retaining from earnings. When you combine this payout with the ROE, the implied dividend growth rate used in the model is about a 3.28% decline each year, based on the formula stated as Calculated (1 – Payout Ratio) x ROE, (1 – 151.19%) x 6.41%.
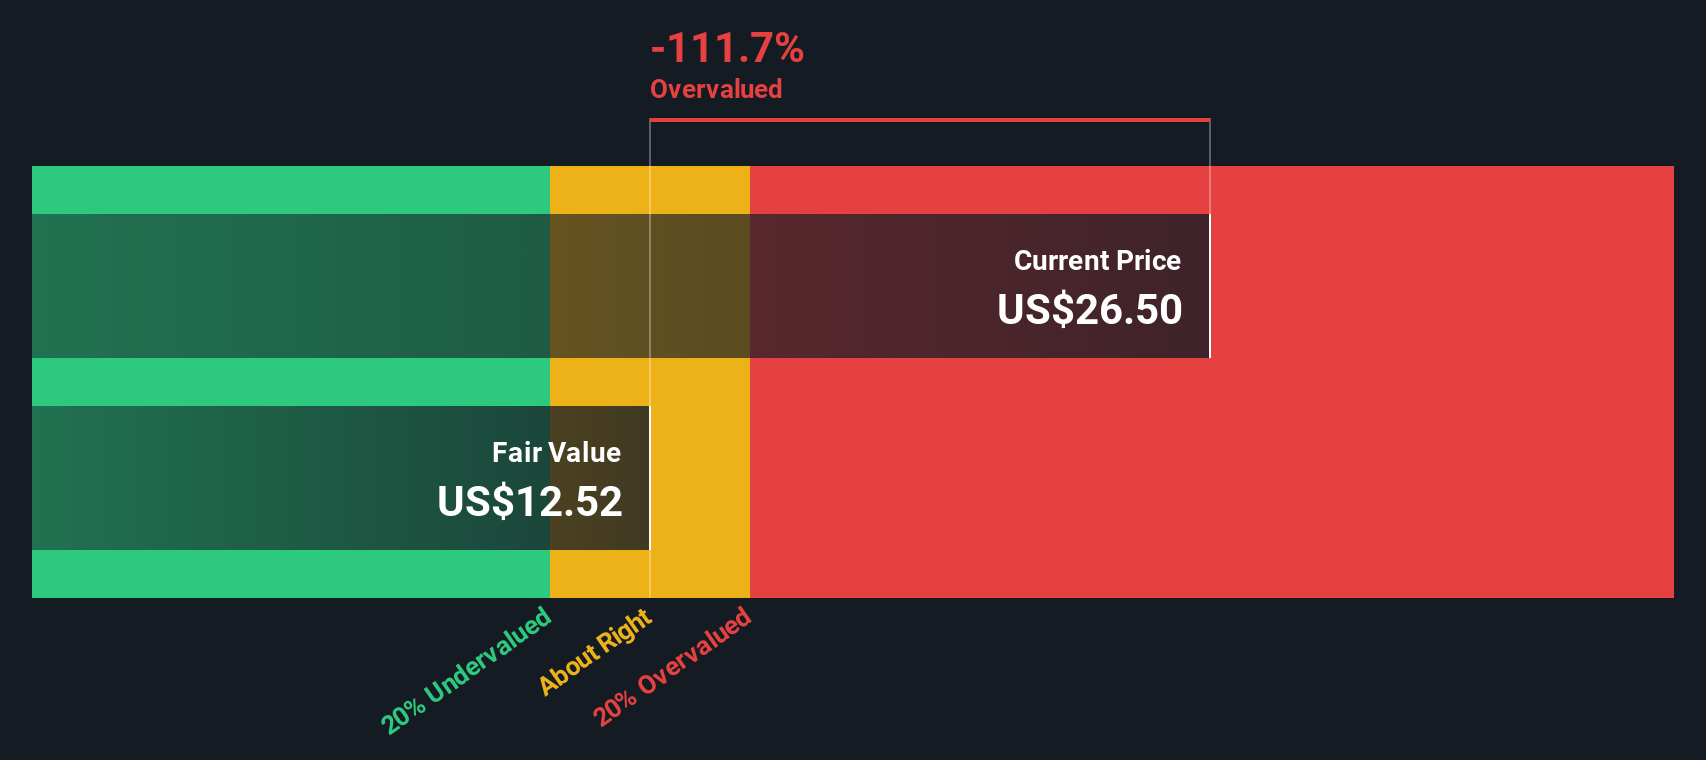
Using these dividend projections, the DDM arrives at an estimated intrinsic value of $12.51 per share. Compared with the current share price, this implies the stock is 125.9% overvalued according to this model.
Result: OVERVALUED
Our Dividend Discount Model (DDM) analysis suggests Dow may be overvalued by 125.9%. Discover 884 undervalued stocks or create your own screener to find better value opportunities.
 DOW Discounted Cash Flow as at Jan 2026
Approach 2: Dow Price vs Sales
For companies where earnings can be volatile, price based on sales is often a useful cross check, because revenue tends to be more stable than profit and is less affected by accounting decisions.
In general, the P/S multiple that investors are comfortable with reflects what they expect from a company and how much risk they see. Higher expected growth or stronger perceived resilience can support a higher P/S, while more uncertainty or thinner margins usually justifies a lower one.
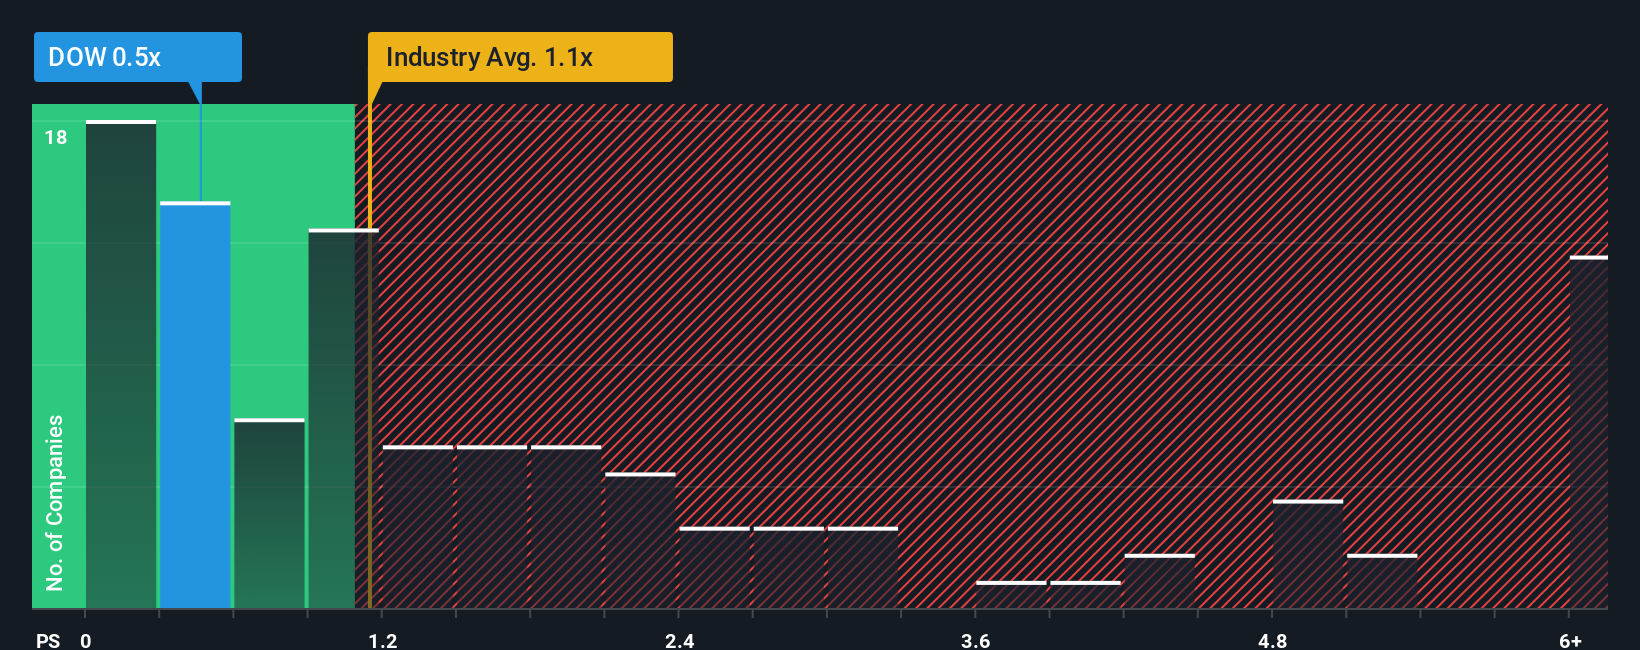
Dow is currently trading on a P/S of 0.49x, compared with the Chemicals industry average of 1.19x and a peer average of 0.72x. Simply Wall St also calculates a Fair Ratio of 0.87x for Dow, which is the P/S level suggested by factors such as its earnings profile, industry, profit margins, market value and risk characteristics.
This Fair Ratio is more tailored than a simple comparison with peers or the wider industry because it adjusts for company specific traits like growth expectations, risk and profitability, rather than assuming that all businesses in the sector deserve the same multiple.
Since Dow’s actual P/S of 0.49x is below the Fair Ratio of 0.87x, this framework points to the shares being undervalued on a sales basis.
Result: UNDERVALUED
 NYSE:DOW P/S Ratio as at Jan 2026
P/S ratios tell one story, but what if the real opportunity lies elsewhere? Discover 1442 companies where insiders are betting big on explosive growth.
Upgrade Your Decision Making: Choose your Dow Narrative
Earlier we mentioned that there is an even better way to understand valuation, so let us introduce you to Narratives, which are short, clear stories you build around your own fair value, revenue, earnings and margin expectations. You then link that story to a financial forecast and a fair value, and compare that fair value to the current price using an easy tool on Simply Wall St’s Community page that updates automatically when new information such as earnings or news arrives. For Dow, one investor might focus on cost discipline, expected revenue of US$43.6b, earnings of US$1.5b, a 4.01% profit margin and a future P/E of 15.22x to support a fair value closer to US$45.00. Another might put more weight on margin pressures, macro risks and a preferred multiple nearer 15.22x to justify a fair value closer to US$20.00. Both Narratives can sit side by side so you can see which story you find more convincing.
Do you think there’s more to the story for Dow? Head over to our Community to see what others are saying!
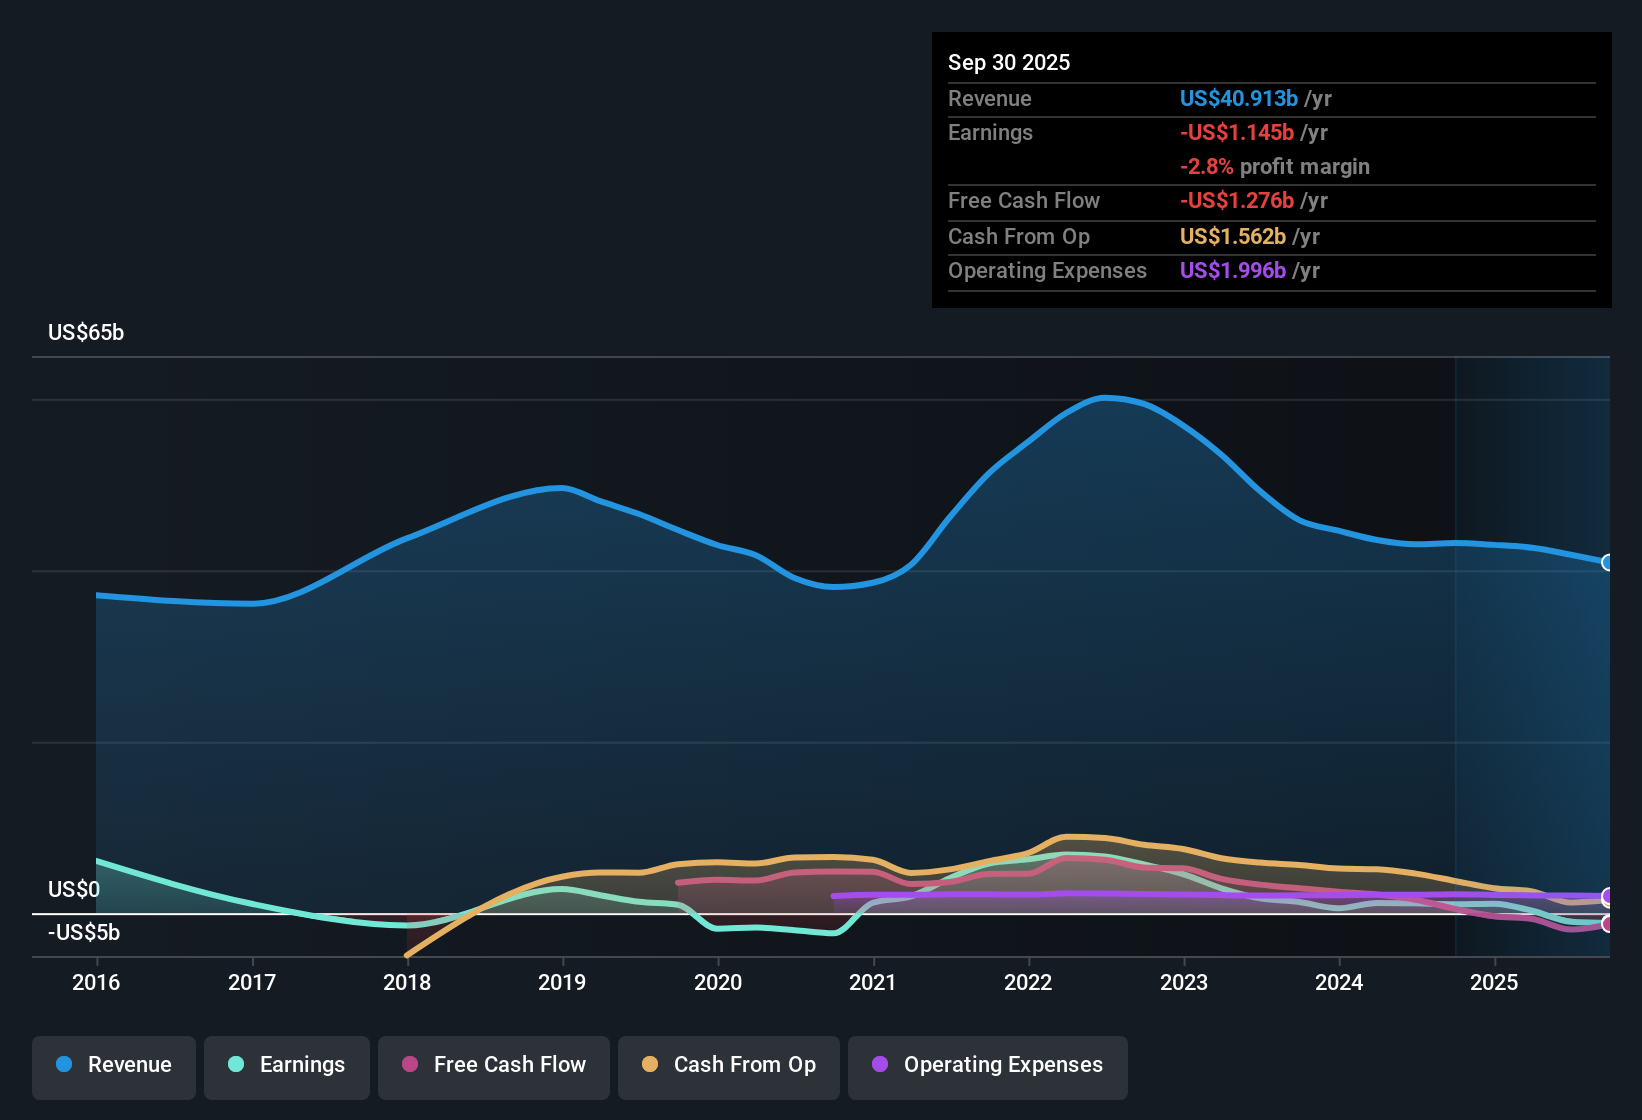 NYSE:DOW Earnings & Revenue History as at Jan 2026
This article by Simply Wall St is general in nature. We provide commentary based on historical data
and analyst forecasts only using an unbiased methodology and our articles are not intended to be financial advice. It does not constitute a recommendation to buy or sell any stock, and does not take account of your objectives, or your
financial situation. We aim to bring you long-term focused analysis driven by fundamental data.
Note that our analysis may not factor in the latest price-sensitive company announcements or qualitative material.
Simply Wall St has no position in any stocks mentioned.
We’ve created the ultimate portfolio companion for stock investors, and it’s free.
• Connect an unlimited number of Portfolios and see your total in one currency
• Be alerted to new Warning Signs or Risks via email or mobile
• Track the Fair Value of your stocks
Have feedback on this article? Concerned about the content? Get in touch with us directly. Alternatively, email editorial-team@simplywallst.com