
Bitcoin (BTC), Ethereum (ETH), and Ripple (XRP) prices face a correction on Monday as renewed EU–US trade-war concerns dent risk sentiment across global assets. BTC slipped below $93,000 while ETH and XRP followed BTC’s footsteps and traded lower. The top three cryptocurrencies are nearing their key support levels; a firm close below these levels could extend a deeper correction.
Bitcoin could extend its correction if it closes below 50-day EMA
Bitcoin price rallied to a nearly two-month high of $97,800 on Wednesday, finding support around the previously broken upper consolidation zone at $90,000. However, BTC failed to sustain its upward momentum and declined by 3.17% over the next four days. As of Monday, BTC is trading down, retesting the 50-day Exponential Moving Average (EMA) at $92,396.
If BTC closes below the 50-day EMA at $92,396 on a daily basis, it could extend the decline toward the next key support at $90,000.
The Relative Strength Index (RSI) on the daily chart reads 52, pointing down toward the neutral level of 50, indicating fading bullish momentum. For the bearish momentum to be sustained, the RSI must move below the neutral level. The Moving Average Convergence Divergence (MACD) indicator lines are converging, indicating indecision among traders. If the MACD flips a bearish crossover, it would further support the bearish view.
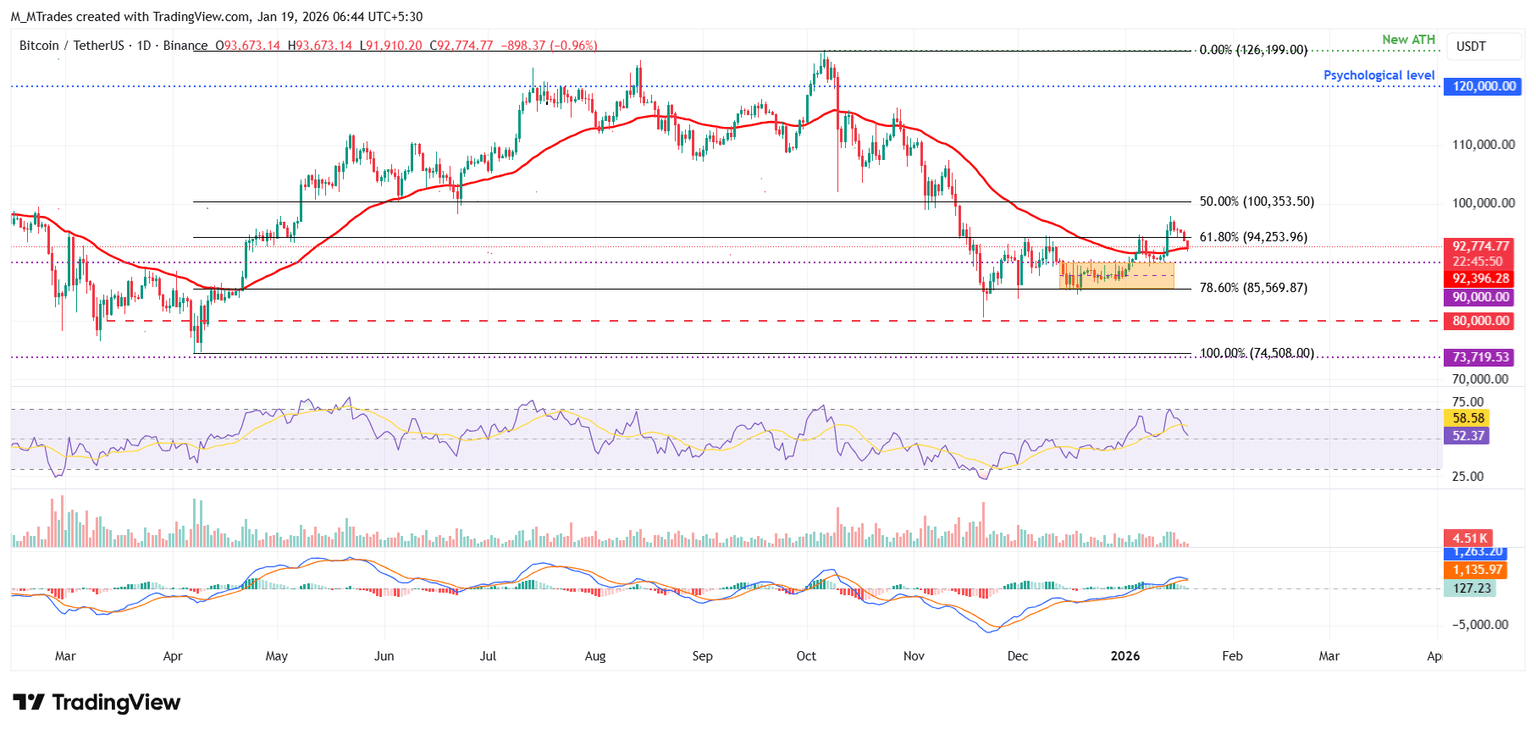
BTC/USDT daily chart
However, if BTC recovers, it could extend its rally toward the $100,000 psychological level.
Ethereum faces rejection from the 200-day EMA
Ethereum price was rejected from the 200-day EMA at $3,336 on Thursday and declined nearly 3% through Sunday. As of Monday, ETH trades down, retesting the 50-day EMA at $3,166.
If ETH closes below the 50-day EMA at $3,166 on a daily basis, it could extend the decline toward the daily support at $3,017.
Like Bitcoin, Ethereum’s RSI and MACD are showing fading bullish momentum.
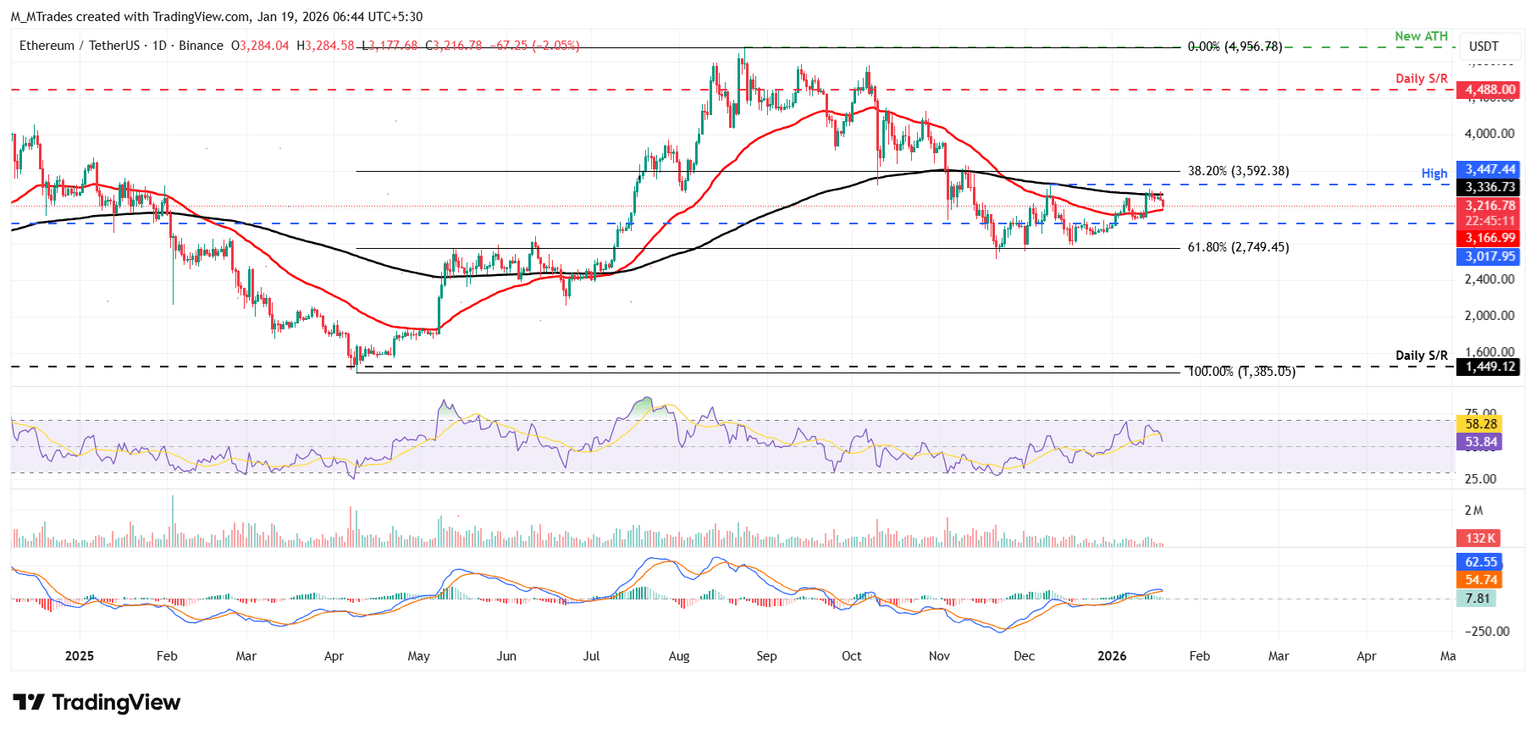
ETH/USDT daily chart
On the other hand, if the 50-day EMA holds as support, ETH could extend the recovery toward the 200-day EMA at $3,336.
XRP momentum indicators show bearish signs
XRP price faced rejection from the 50-day EMA at $2.06 on Friday and declined nearly 5% through Sunday. At the time of writing on Monday, XRP is trading down at $1.95.
If XRP continues its correction and closes below the daily support at $1.96, it could extend the decline toward the December 19 low of $1.77.
The RSI on the daily chart reads 42, below the neutral level of 50, indicating bearish momentum gaining traction. The MACD also showed a bearish crossover on Friday, further supporting the negative outlook.
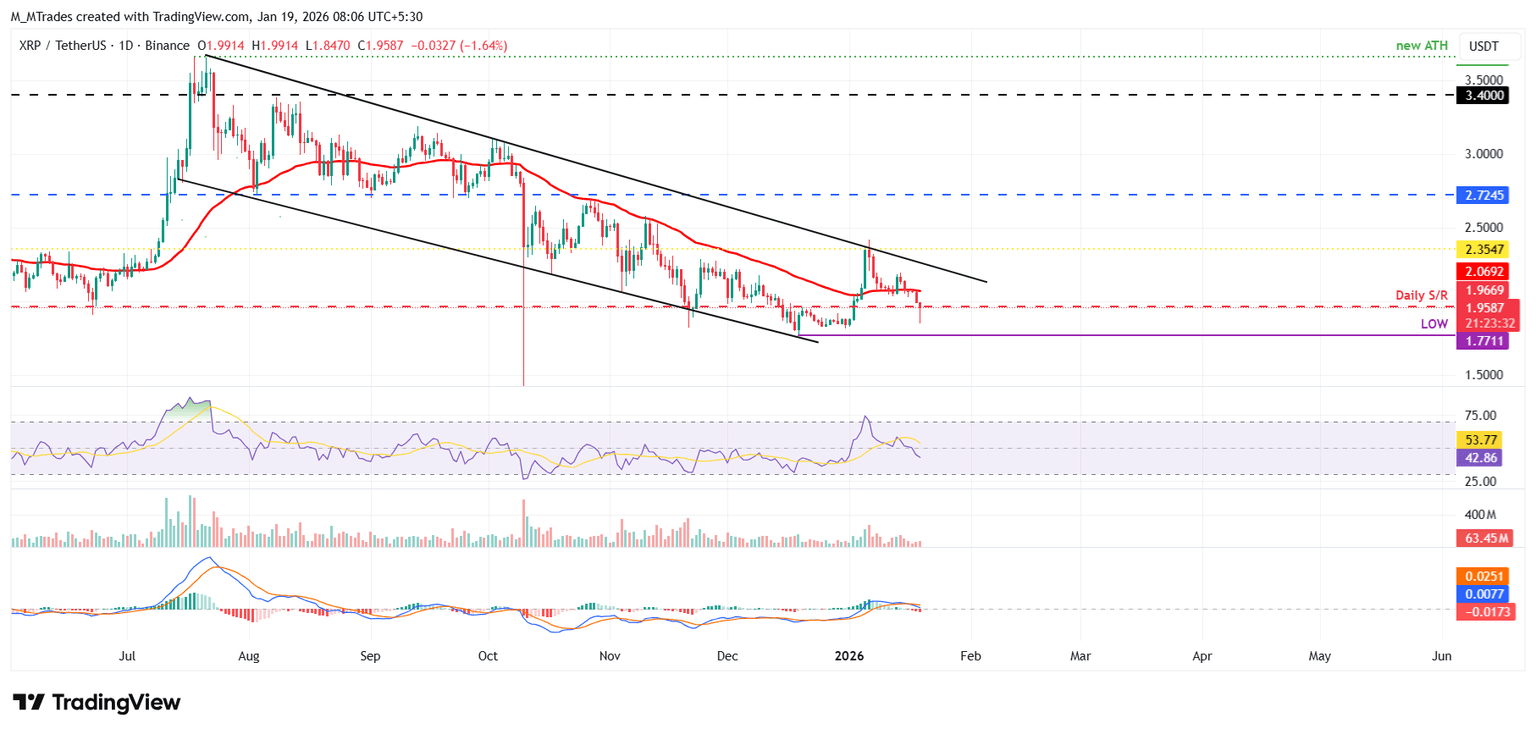
XRP/USDT daily chart
However, if the daily support at $1.96 holds, XRP could extend the recovery toward the 50-day EMA at $2.06.