
Approach 1: UiPath Discounted Cash Flow (DCF) Analysis
A Discounted Cash Flow model takes the cash UiPath is expected to generate in the future, then discounts those projections back to today to estimate what the business could be worth right now.
UiPath’s latest twelve month free cash flow is about $319.9 million. Analysts and model estimates project free cash flow rising to $368.7 million in 2026 and $419.9 million in 2027, reaching $471.2 million by 2028. Beyond that, Simply Wall St extrapolates cash flows out to 2035 using a 2 Stage Free Cash Flow to Equity model, with each year’s cash flow discounted back to today.
Putting those projections together, the DCF model arrives at an estimated intrinsic value of about $17.78 per share. Compared with the recent share price of $14.20, that implies a 20.1% discount, which indicates UiPath shares are currently trading below this cash flow based estimate of fair value.
Result: UNDERVALUED
Our Discounted Cash Flow (DCF) analysis suggests UiPath is undervalued by 20.1%. Track this in your watchlist or portfolio, or discover 881 more undervalued stocks based on cash flows.
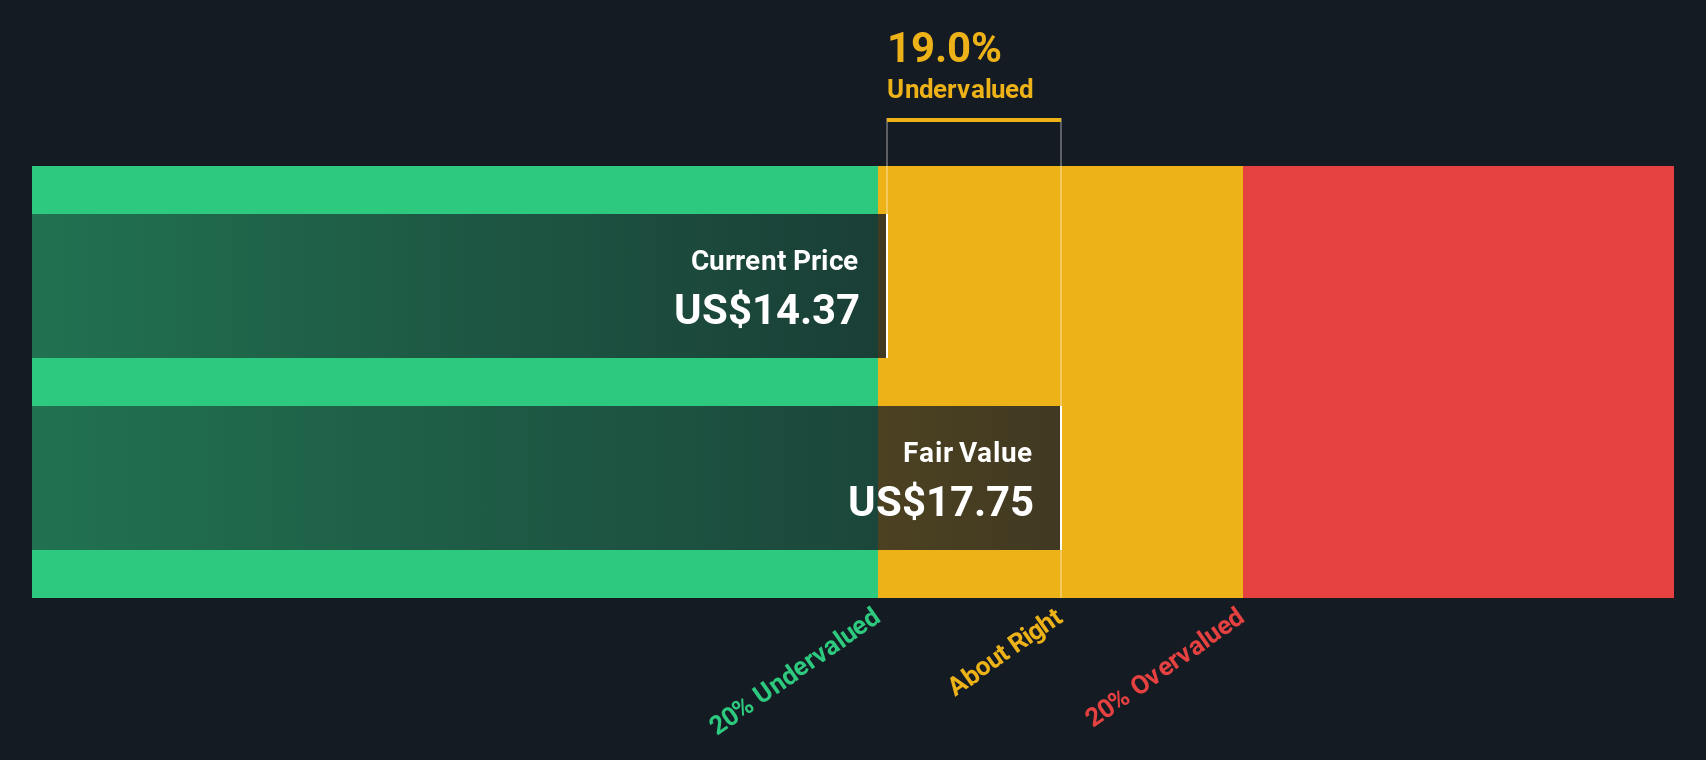 PATH Discounted Cash Flow as at Jan 2026
Approach 2: UiPath Price vs Earnings
For profitable companies, the P/E ratio is a practical way to think about valuation because it links what you pay for each share directly to the earnings that business is generating today.
What counts as a “normal” P/E depends a lot on how the market sees the company’s growth potential and risk. Higher expected growth or lower perceived risk can justify a higher P/E, while slower expected growth or higher risk often lines up with a lower multiple.
UiPath currently trades on a P/E of 33.1x. That sits above the broader Software industry average of 30.9x, and below the peer group average of 53.7x. Those comparisons are useful, but they are quite broad and do not fully reflect UiPath’s specific earnings profile.
Simply Wall St’s Fair Ratio of 14.4x is a proprietary estimate of what UiPath’s P/E might be given its earnings growth characteristics, industry, profit margins, market cap and risk factors. Because it is tailored to the company’s own fundamentals, this Fair Ratio is more targeted than a simple industry or peer comparison.
With the current P/E of 33.1x sitting well above the Fair Ratio of 14.4x, this multiple-based view suggests the shares are trading richer than this model would expect.
Result: OVERVALUED
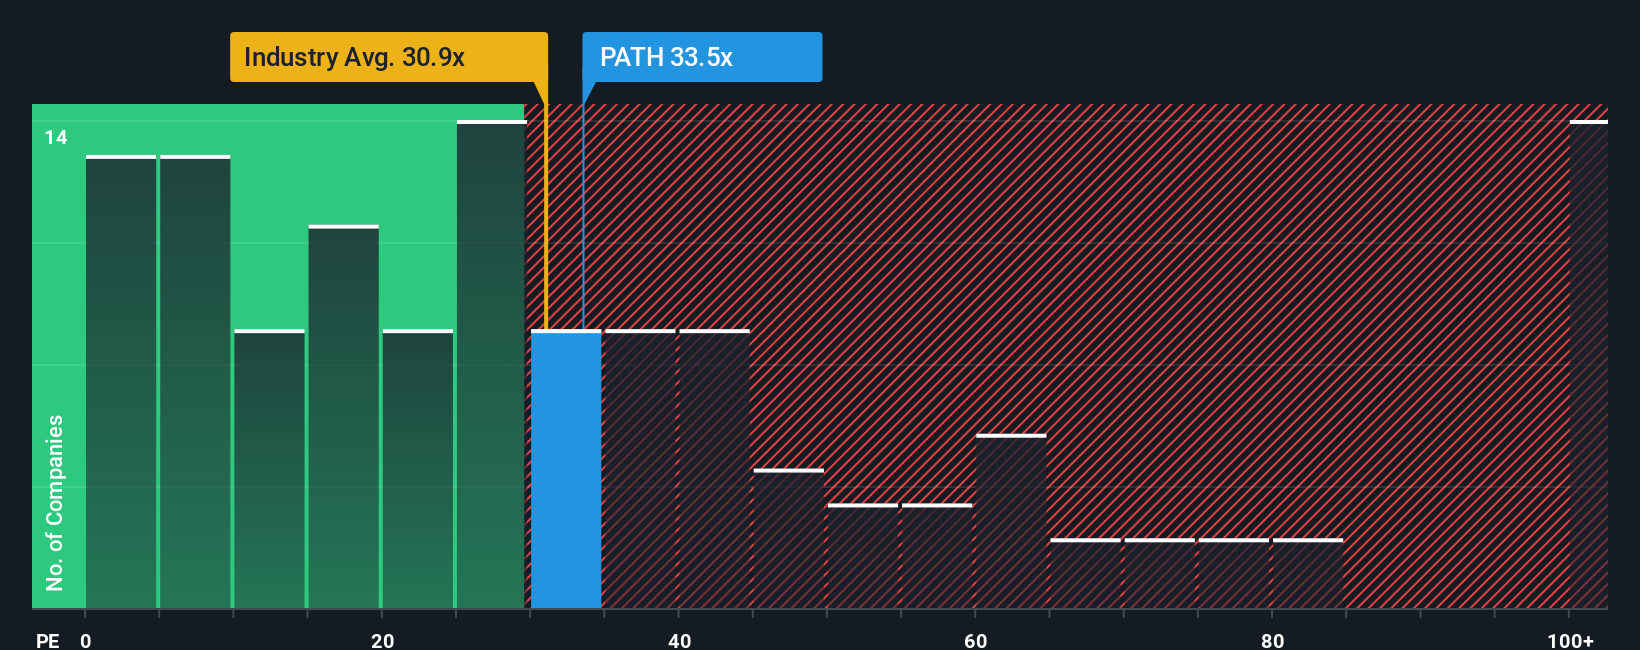 NYSE:PATH P/E Ratio as at Jan 2026
P/E ratios tell one story, but what if the real opportunity lies elsewhere? Discover 1447 companies where insiders are betting big on explosive growth.
Upgrade Your Decision Making: Choose your UiPath Narrative
Earlier we mentioned that there is an even better way to understand valuation, so let us introduce you to Narratives.
A Narrative is simply your story about a company, written in numbers as well as words, where you link your view on its products, competition and risks to explicit assumptions about future revenue, earnings and margins.
On Simply Wall St, Narratives live on the Community page and help you turn that story into a financial forecast and a fair value estimate that you can compare directly with the current share price to decide whether the stock looks attractive, fully priced or expensive for you.
Because Narratives update when new information such as news or earnings is added, you can keep your view current without rebuilding your thinking from scratch. You can also see how other investors may rate UiPath very differently based on their own assumptions. For example, one Narrative might see a fair value well above US$17.78, while another might see it well below the recent US$14.20 price.
Do you think there’s more to the story for UiPath? Head over to our Community to see what others are saying!
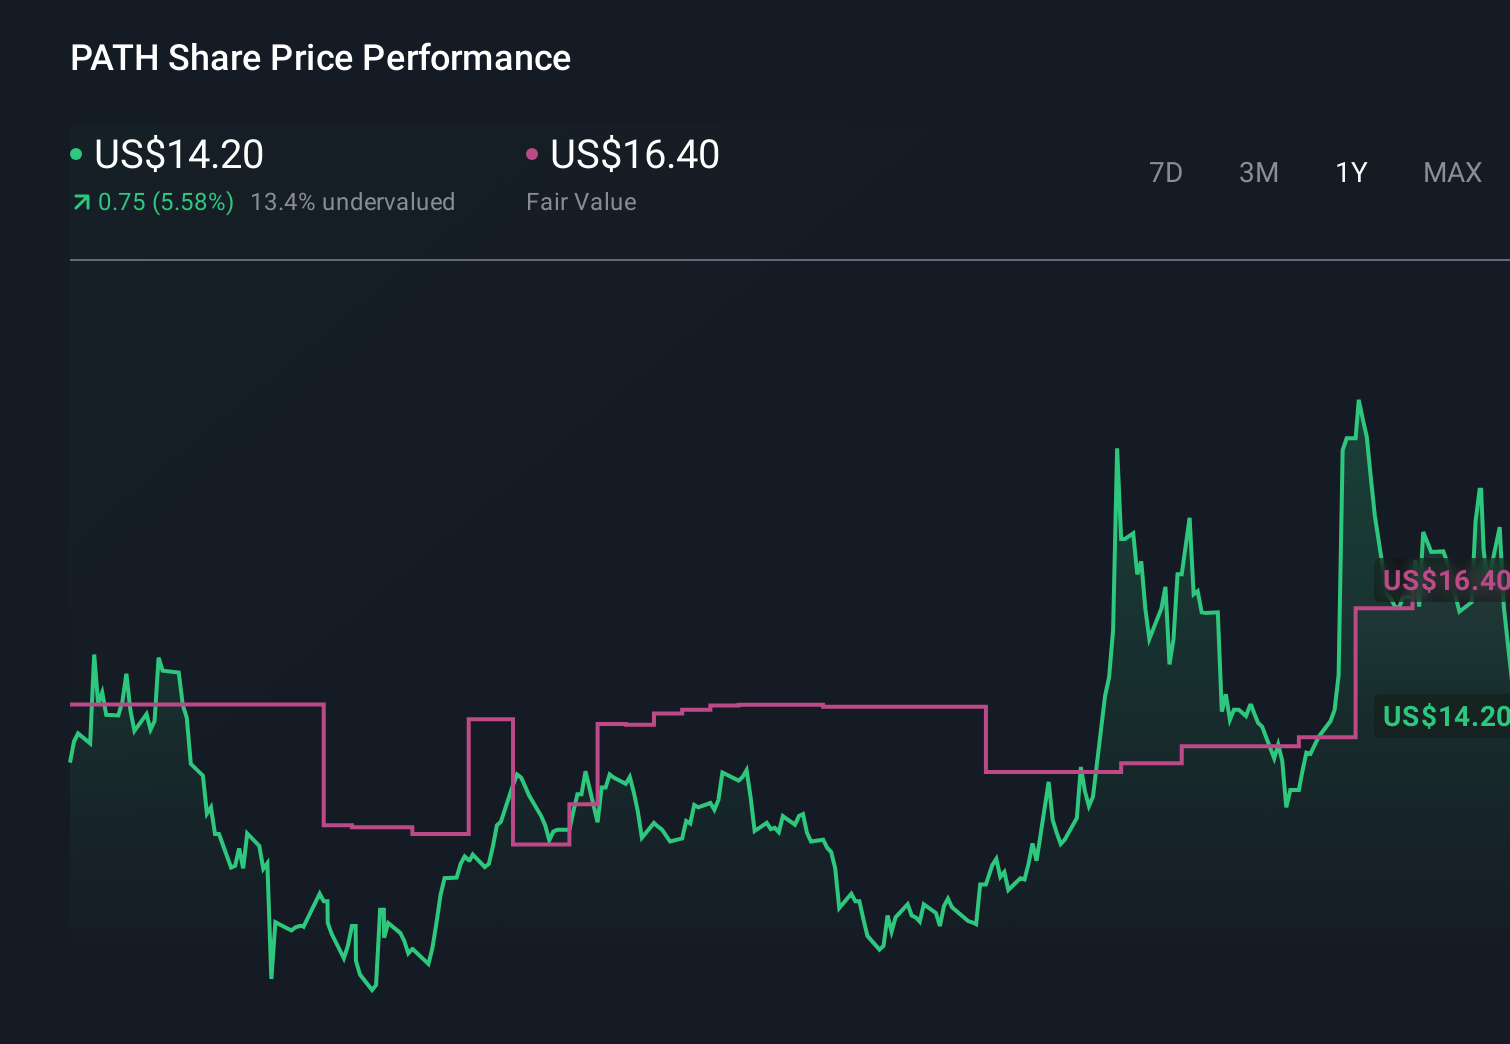 NYSE:PATH 1-Year Stock Price Chart
This article by Simply Wall St is general in nature. We provide commentary based on historical data
and analyst forecasts only using an unbiased methodology and our articles are not intended to be financial advice. It does not constitute a recommendation to buy or sell any stock, and does not take account of your objectives, or your
financial situation. We aim to bring you long-term focused analysis driven by fundamental data.
Note that our analysis may not factor in the latest price-sensitive company announcements or qualitative material.
Simply Wall St has no position in any stocks mentioned.
Our new AI Stock Screener scans the market every day to uncover opportunities.
• Dividend Powerhouses (3%+ Yield)
• Undervalued Small Caps with Insider Buying
• High growth Tech and AI Companies
Or build your own from over 50 metrics.
Have feedback on this article? Concerned about the content? Get in touch with us directly. Alternatively, email editorial-team@simplywallst.com