
Approach 1: Global Business Travel Group Discounted Cash Flow (DCF) Analysis
A Discounted Cash Flow, or DCF, model estimates what a company could be worth today by projecting its future cash flows and discounting them back to a present value.
For Global Business Travel Group, the model used is a 2 Stage Free Cash Flow to Equity approach. The company’s latest twelve month free cash flow is about $129.7 million, and analysts provide specific forecasts out to 2028, with Simply Wall St extrapolating further to build a 10 year cash flow path. Within those projections, forecast free cash flow for 2028 is $425 million, and later years range from $462.6 million to $625.9 million, all stated in $.
When all those projected cash flows are discounted back, the estimated intrinsic value comes out at US$13.90 per share, compared with the current share price of US$7.15. That implied 48.6% discount suggests the shares are currently priced below this DCF estimate.
Result: UNDERVALUED
Our Discounted Cash Flow (DCF) analysis suggests Global Business Travel Group is undervalued by 48.6%. Track this in your watchlist or portfolio, or discover 886 more undervalued stocks based on cash flows.
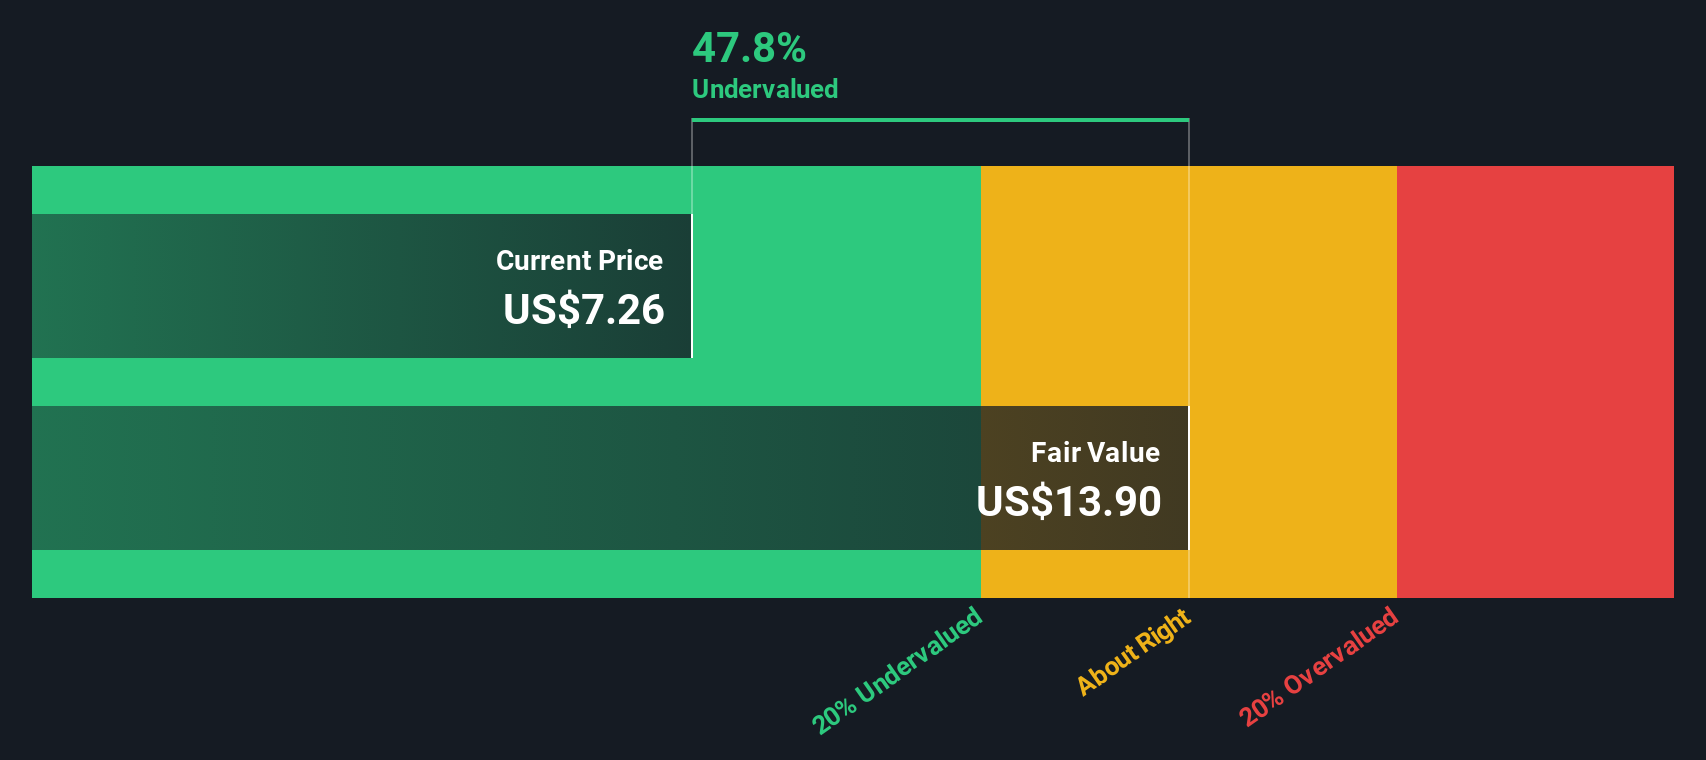 GBTG Discounted Cash Flow as at Jan 2026
Approach 2: Global Business Travel Group Price vs Sales
For companies where revenue is a clearer marker than current earnings, the P/S ratio can be a practical way to think about value. It links what investors are paying directly to the sales the business is generating, which is particularly useful when profit metrics are less informative or volatile.
Growth expectations and risk still matter here, because a higher growth outlook or lower perceived risk can justify a higher P/S, while slower expected growth or higher risk usually lines up with a lower, more cautious multiple.
Global Business Travel Group currently trades on a P/S of 1.49x. That compares with a Hospitality industry average P/S of 1.63x and a peer group average of 3.40x. Simply Wall St also calculates a Fair Ratio for the company of 2.13x. This Fair Ratio is a proprietary estimate of what a reasonable P/S might be for Global Business Travel Group, taking into account factors such as its earnings growth profile, profit margins, industry, market capitalization and risk characteristics.
Because the Fair Ratio blends these company specific inputs, it can be more tailored than a simple comparison with broad industry or peer averages. With the current P/S of 1.49x below the Fair Ratio of 2.13x, the shares screen as undervalued on this metric.
Result: UNDERVALUED
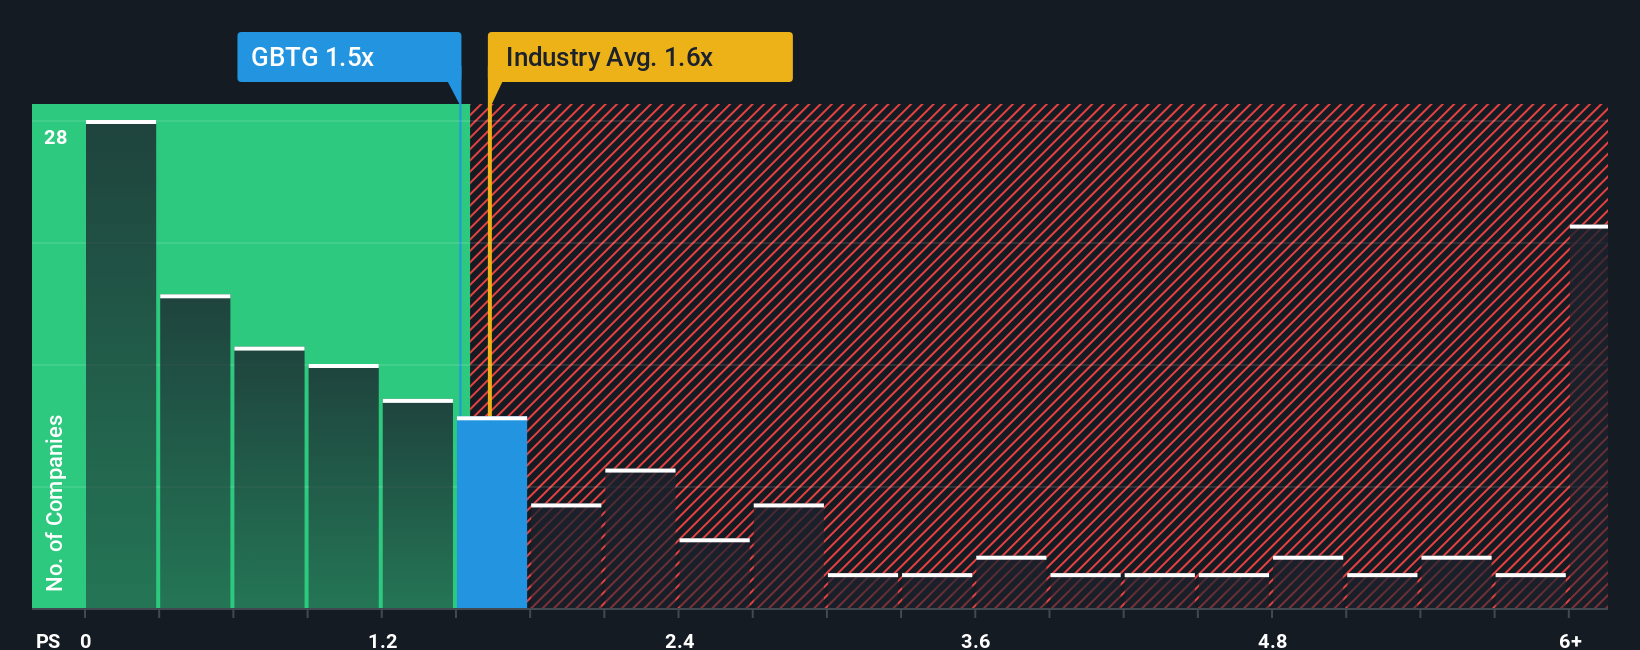 NYSE:GBTG P/S Ratio as at Jan 2026
P/S ratios tell one story, but what if the real opportunity lies elsewhere? Discover 1424 companies where insiders are betting big on explosive growth.
Upgrade Your Decision Making: Choose your Global Business Travel Group Narrative
Earlier we mentioned that there is an even better way to understand valuation, so let us introduce you to Narratives, which are simply your own story for a company linked directly to your assumptions for fair value, future revenue, earnings and margins.
On Simply Wall St, Narratives sit in the Community page and give you an easy way to connect what you believe about Global Business Travel Group with a financial forecast and then a fair value, so you can quickly see how that compares with the current share price and decide whether it looks more like a buy, a hold or a sell for you.
Because Narratives are updated automatically when new information such as news or earnings appears, your story, the forecast numbers and the implied fair value keep adjusting without you needing to rebuild a spreadsheet every time something changes.
For example, one Global Business Travel Group Narrative on the platform might assume a relatively high fair value with stronger long term revenue and margin expectations, while another Narrative might set a lower fair value based on more cautious assumptions about growth and profitability, showing how different investors can look at the same stock and reach very different conclusions.
Do you think there’s more to the story for Global Business Travel Group? Head over to our Community to see what others are saying!
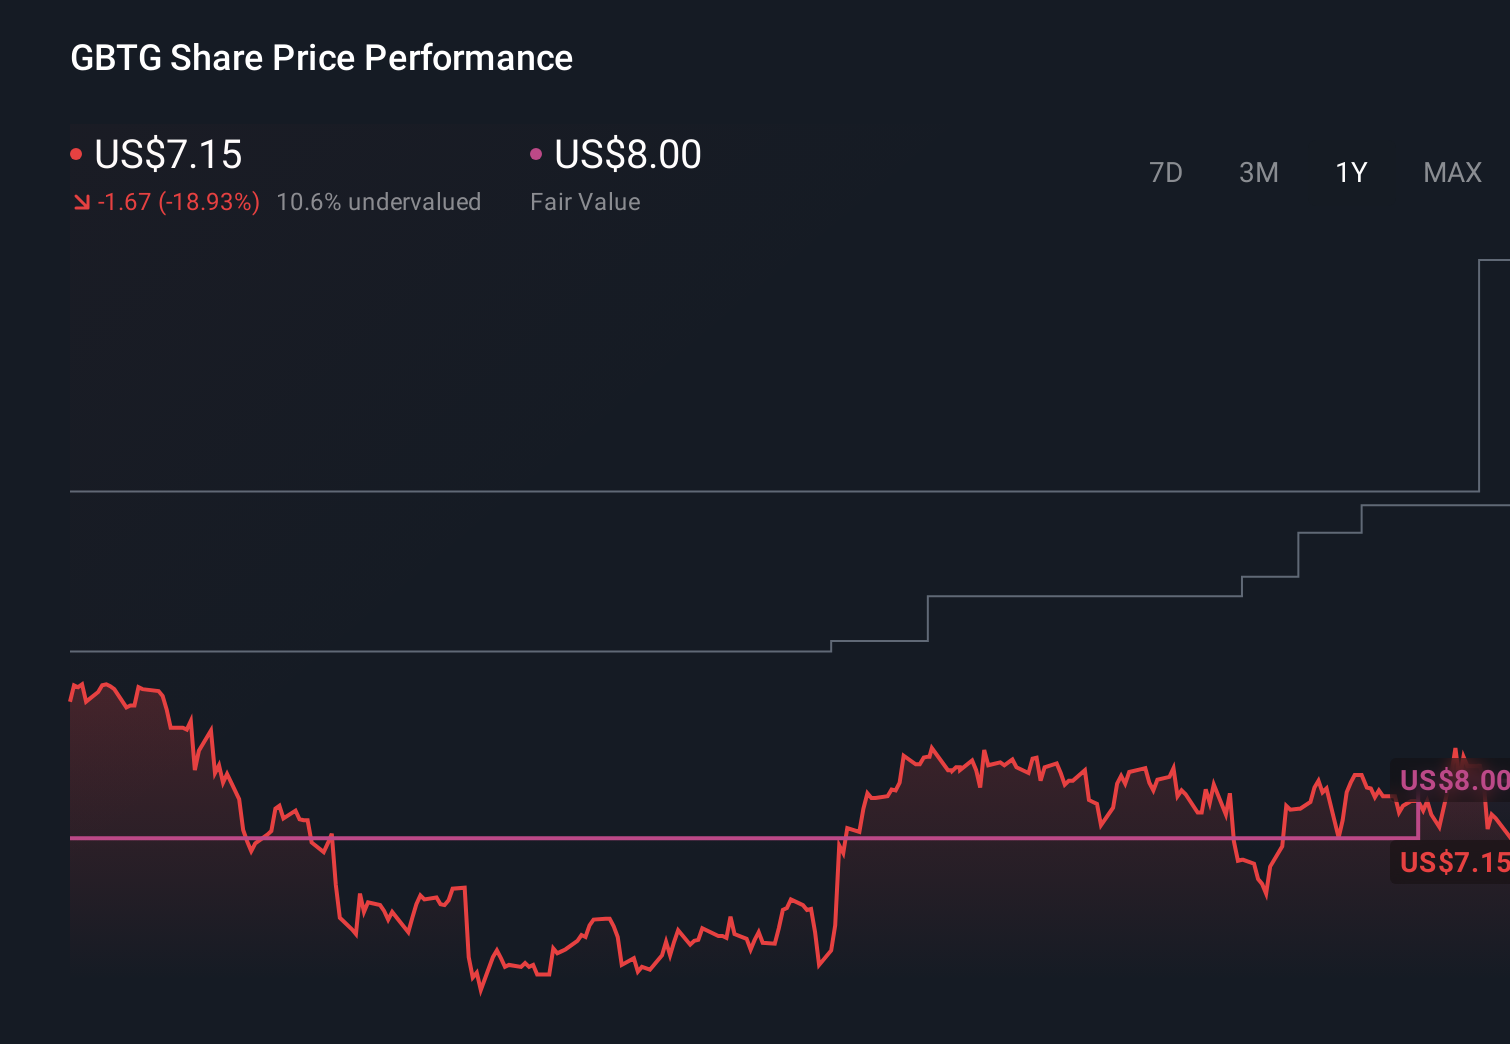 NYSE:GBTG 1-Year Stock Price Chart
This article by Simply Wall St is general in nature. We provide commentary based on historical data
and analyst forecasts only using an unbiased methodology and our articles are not intended to be financial advice. It does not constitute a recommendation to buy or sell any stock, and does not take account of your objectives, or your
financial situation. We aim to bring you long-term focused analysis driven by fundamental data.
Note that our analysis may not factor in the latest price-sensitive company announcements or qualitative material.
Simply Wall St has no position in any stocks mentioned.
We’ve created the ultimate portfolio companion for stock investors, and it’s free.
• Connect an unlimited number of Portfolios and see your total in one currency
• Be alerted to new Warning Signs or Risks via email or mobile
• Track the Fair Value of your stocks
Have feedback on this article? Concerned about the content? Get in touch with us directly. Alternatively, email editorial-team@simplywallst.com