Golar LNG scores just 1/6 on our valuation checks. See what other red flags we found in the full valuation breakdown.
Approach 1: Golar LNG Dividend Discount Model (DDM) Analysis
The Dividend Discount Model estimates what a share might be worth by projecting future dividends and discounting them back to today. It is essentially asking what a rational buyer would pay now for the stream of dividends they expect to receive over time.
For Golar LNG, the model uses a current dividend per share (DPS) of US$1. The payout ratio is 92.56%, which means most of the earnings are being paid out as dividends. That leaves only a small portion to reinvest, which, combined with a return on equity of 4.24%, produces an implied dividend growth rate of about 0.32%. This growth rate is calculated as the product of the retention ratio and ROE, using the formula provided.
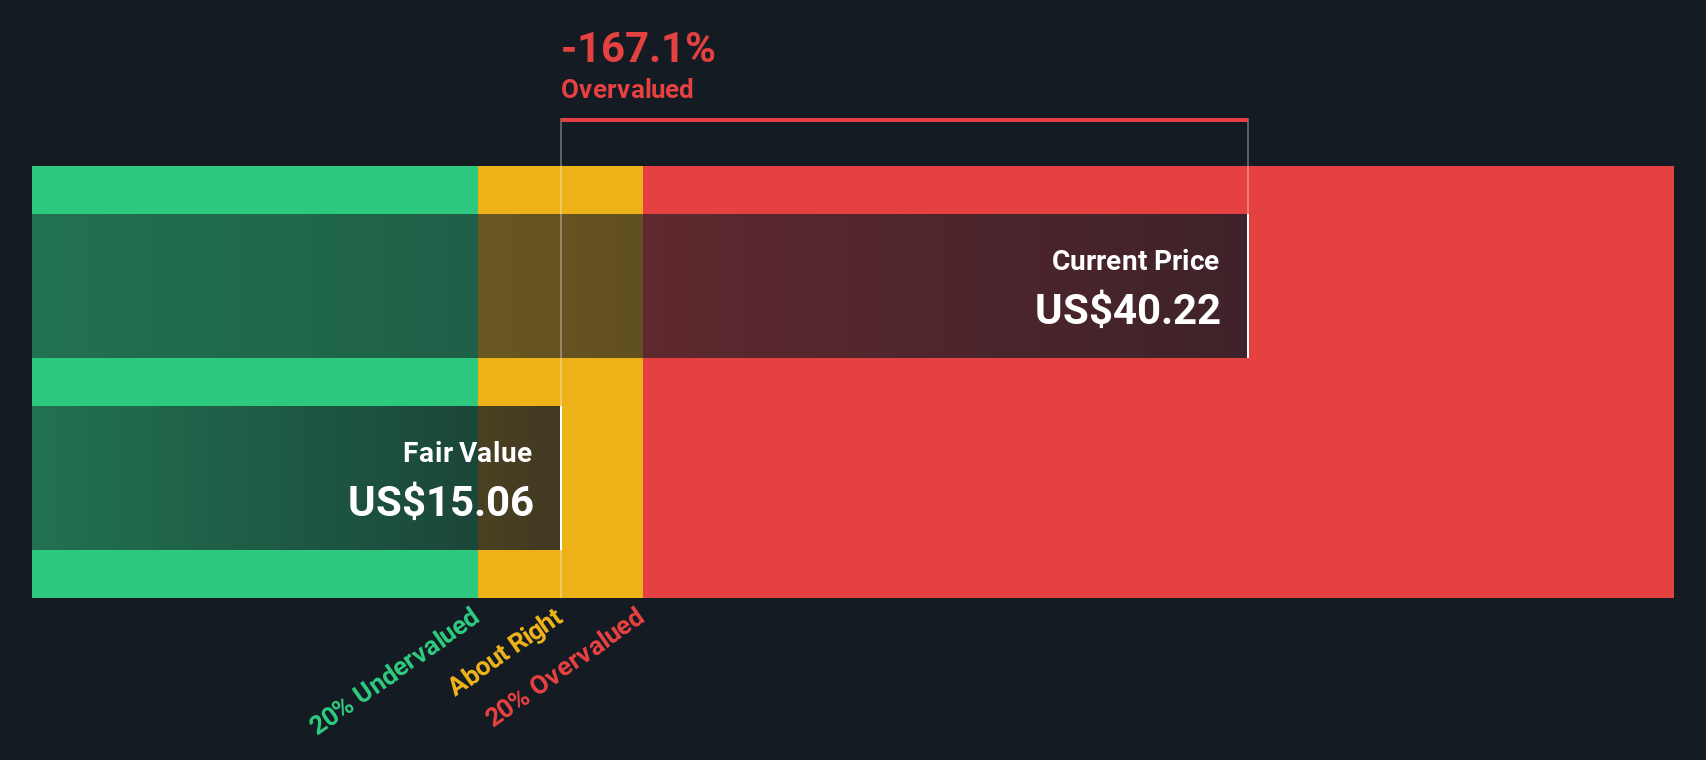
On these inputs, the DDM produces an estimated intrinsic value of roughly US$15.06 per share. Compared with the recent share price of US$40.22, the model suggests the stock is around 167.1% above this estimate, which points to a rich valuation using this dividend-based metric.
Result: OVERVALUED
Our Dividend Discount Model (DDM) analysis suggests Golar LNG may be overvalued by 167.1%. Discover 876 undervalued stocks or create your own screener to find better value opportunities.
 GLNG Discounted Cash Flow as at Jan 2026
Approach 2: Golar LNG Price vs Earnings
For a profitable company, the P/E ratio is often a useful yardstick because it ties the share price directly to what the business is currently earning per share. You are essentially asking how many dollars you are paying for each dollar of earnings today.
What counts as a “normal” P/E depends on what investors expect for future growth and how much risk they see in those earnings. Higher growth or lower perceived risk can justify a higher P/E, while slower growth or higher uncertainty usually points to a lower figure being more reasonable.
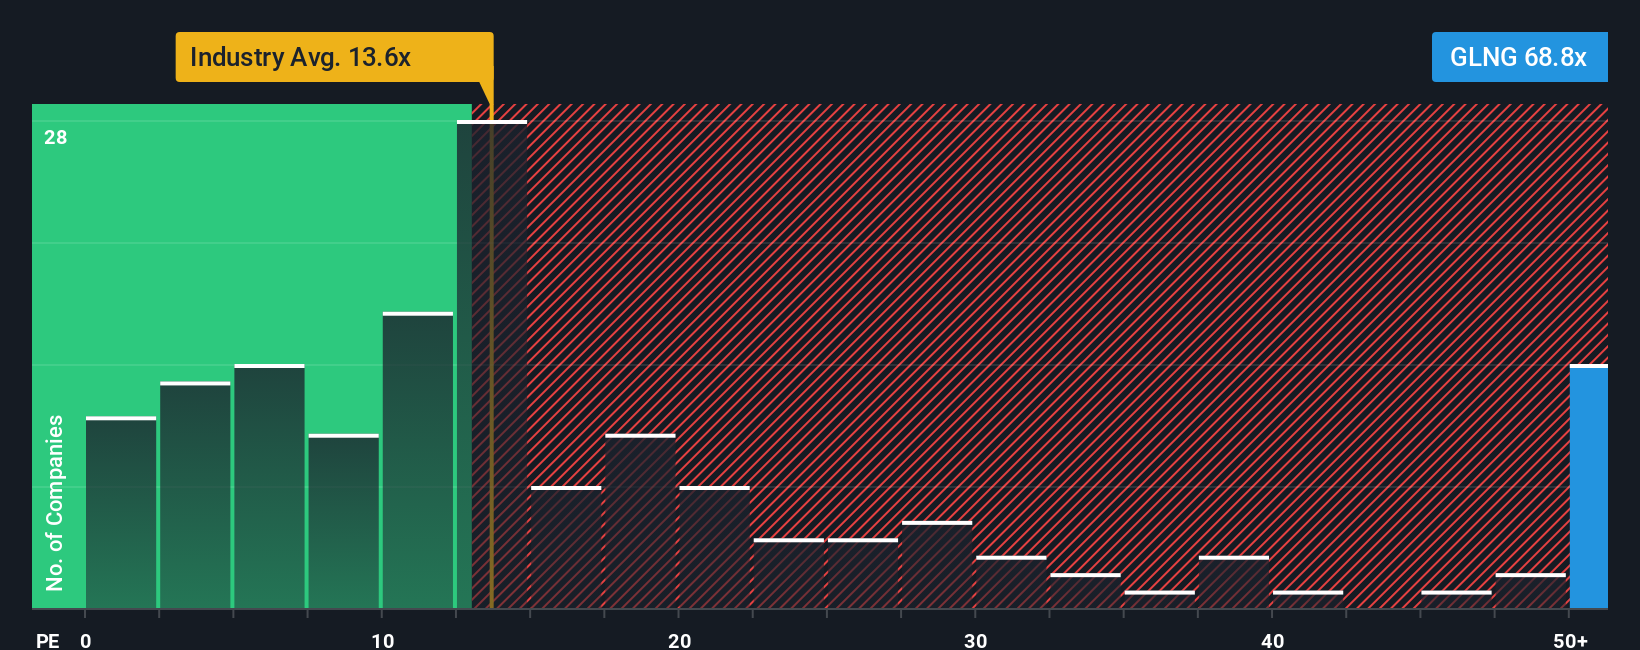
Golar LNG is trading on a P/E of 68.85x, compared with an Oil and Gas industry average of 13.60x and a peer average of 30.78x. Simply Wall St’s “Fair Ratio” for Golar LNG is 18.87x. This Fair Ratio is a proprietary estimate of what a balanced P/E might look like after considering factors such as the company’s earnings growth profile, its industry, profit margins, market cap and risk characteristics. That makes it more tailored than a simple comparison with peers or the broad industry, which may differ on growth, risk and profitability. Set against this Fair Ratio, Golar LNG’s current P/E suggests the shares are pricing in a higher level of optimism than this framework implies.
Result: OVERVALUED
 NasdaqGS:GLNG P/E Ratio as at Jan 2026
P/E ratios tell one story, but what if the real opportunity lies elsewhere? Discover 1422 companies where insiders are betting big on explosive growth.
Upgrade Your Decision Making: Choose your Golar LNG Narrative
Earlier we mentioned that there is an even better way to understand valuation, so let us introduce you to Narratives, which are simply your story about a company, linked directly to your assumptions for its future revenue, earnings, margins and fair value.
On Simply Wall St’s Community page, Narratives let you connect what you believe about Golar LNG’s business, such as its LNG shipping and infrastructure role, to a clear financial forecast and a fair value estimate that you can compare with today’s share price.
You can quickly see whether your Narrative suggests Golar LNG looks expensive or inexpensive by lining up your Fair Value with the current Price. This can help you decide if you want to wait, build a position, or review your thesis.
Narratives on the platform are updated automatically when fresh information like earnings reports or news is added. This helps your fair value view stay aligned with what is happening without you rebuilding everything from scratch.
For example, some Golar LNG Narratives on Simply Wall St assume a relatively low fair value based on cautious revenue and margin estimates, while others assume a much higher fair value based on more optimistic views of future earnings potential.
Do you think there’s more to the story for Golar LNG? Head over to our Community to see what others are saying!
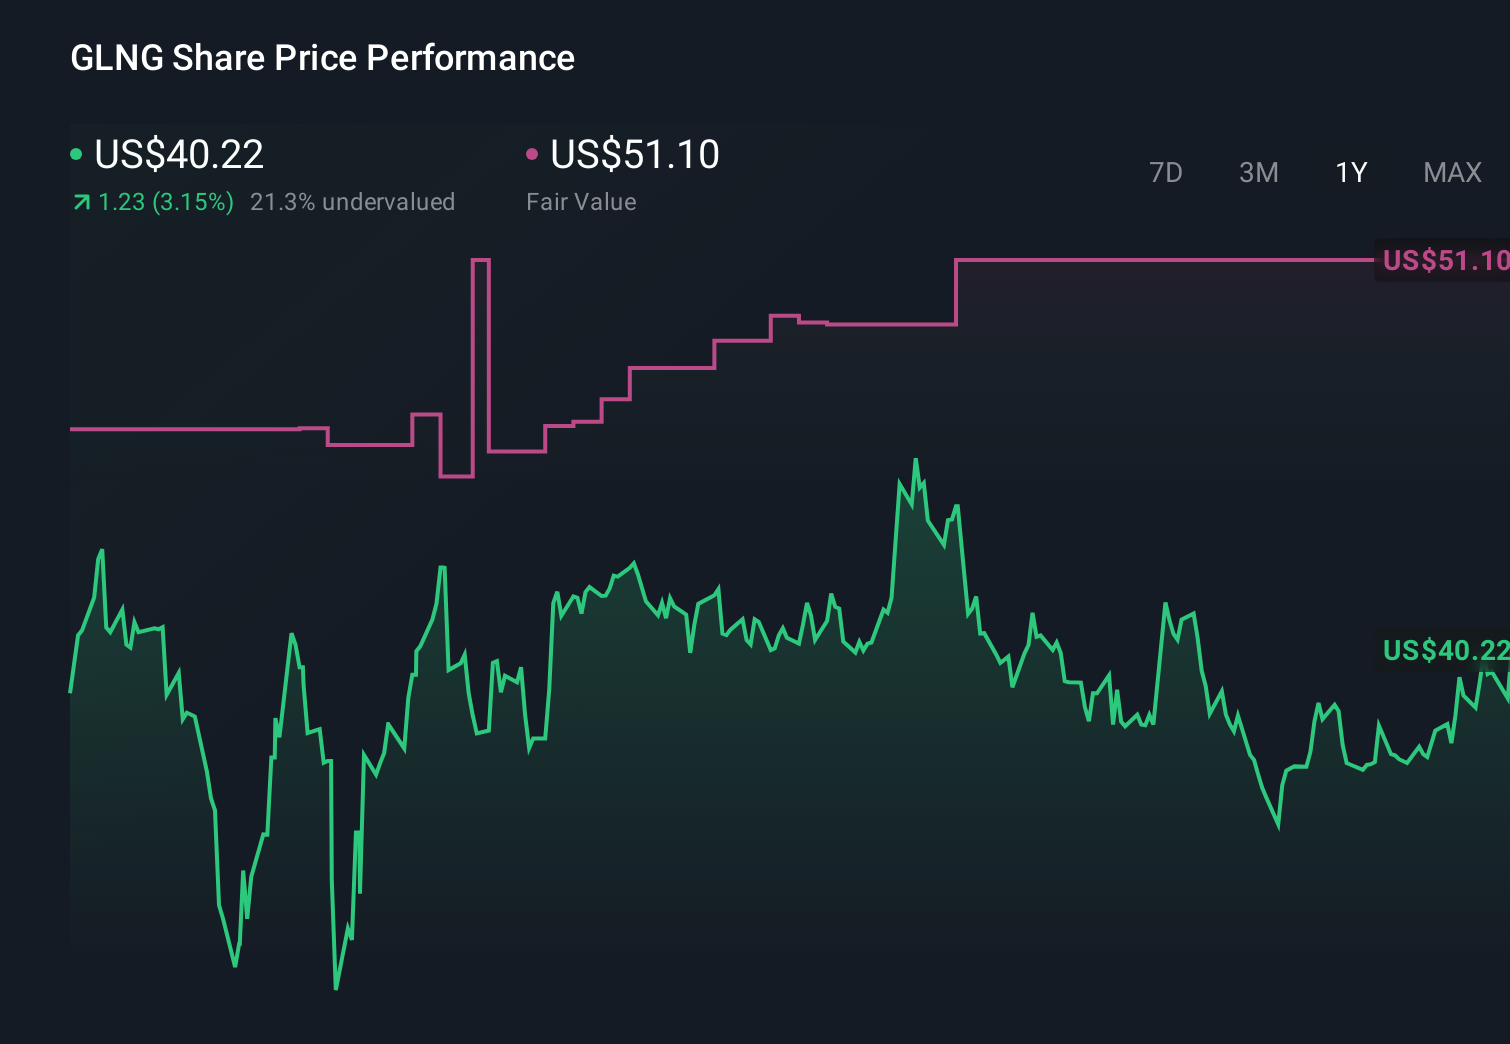 NasdaqGS:GLNG 1-Year Stock Price Chart
This article by Simply Wall St is general in nature. We provide commentary based on historical data
and analyst forecasts only using an unbiased methodology and our articles are not intended to be financial advice. It does not constitute a recommendation to buy or sell any stock, and does not take account of your objectives, or your
financial situation. We aim to bring you long-term focused analysis driven by fundamental data.
Note that our analysis may not factor in the latest price-sensitive company announcements or qualitative material.
Simply Wall St has no position in any stocks mentioned.
We’ve created the ultimate portfolio companion for stock investors, and it’s free.
• Connect an unlimited number of Portfolios and see your total in one currency
• Be alerted to new Warning Signs or Risks via email or mobile
• Track the Fair Value of your stocks
Have feedback on this article? Concerned about the content? Get in touch with us directly. Alternatively, email editorial-team@simplywallst.com