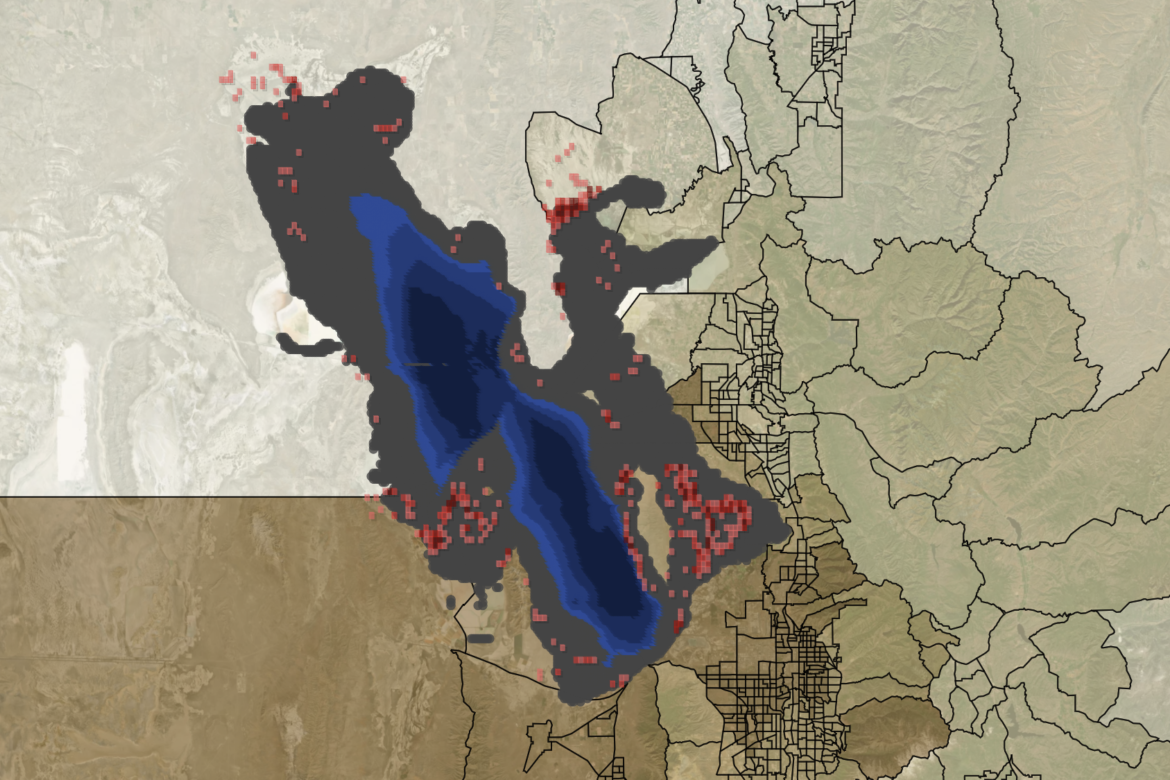
Researchers at the University of Utah have developed an interactive visualization showing how changes in Great Salt Lake water levels affect dust exposure across northern Utah. As lake levels are adjusted, the visualization shows how much lakebed becomes exposed and how dust from those areas is transported toward surrounding communities during dust events. Blue represents the lake’s surface at different elevations, gray shows exposed lakebed and other dust-emitting surfaces, and red marks highly erodible zones that become active dust sources as the lake recedes. By collapsing lake hydrology, dust generation, and community exposure into a single map, the visualization makes the air-quality consequences of declining lake levels immediately and visually legible.