
Feb 4, 2026
IndexBox has just published a new report: Latin America and the Caribbean – Toluene – Market Analysis, Forecast, Size, Trends And Insights.
The article provides a comprehensive analysis of the toluene market in Latin America and the Caribbean from 2013 to 2024, with forecasts to 2035. It details that market volume is expected to grow at a CAGR of +0.9% to 1.2M tons by 2035, while market value is projected to increase at a CAGR of +2.3% to $1.2 billion. Brazil is the dominant player, accounting for approximately 50% of both consumption and production. Mexico is the leading importer, driven by significant growth, while Argentina and Brazil are the main exporters. The report covers trends in consumption, production, trade, and pricing, highlighting regional disparities and key country-level dynamics.
Key Findings
Market volume is forecast to reach 1.2M tons by 2035, growing at a CAGR of +0.9%Market value is projected to hit $1.2B by 2035, expanding at a higher CAGR of +2.3%Brazil is the regional leader, comprising about 50% of total consumption and productionMexico is the largest and fastest-growing importer, accounting for 66% of regional importsArgentina and Brazil are the primary exporters, together representing over 70% of total exportsMarket Forecast
Driven by increasing demand for toluene in Latin America and the Caribbean, the market is expected to continue an upward consumption trend over the next decade. Market performance is forecast to retain its current trend pattern, expanding with an anticipated CAGR of +0.9% for the period from 2024 to 2035, which is projected to bring the market volume to 1.2M tons by the end of 2035.
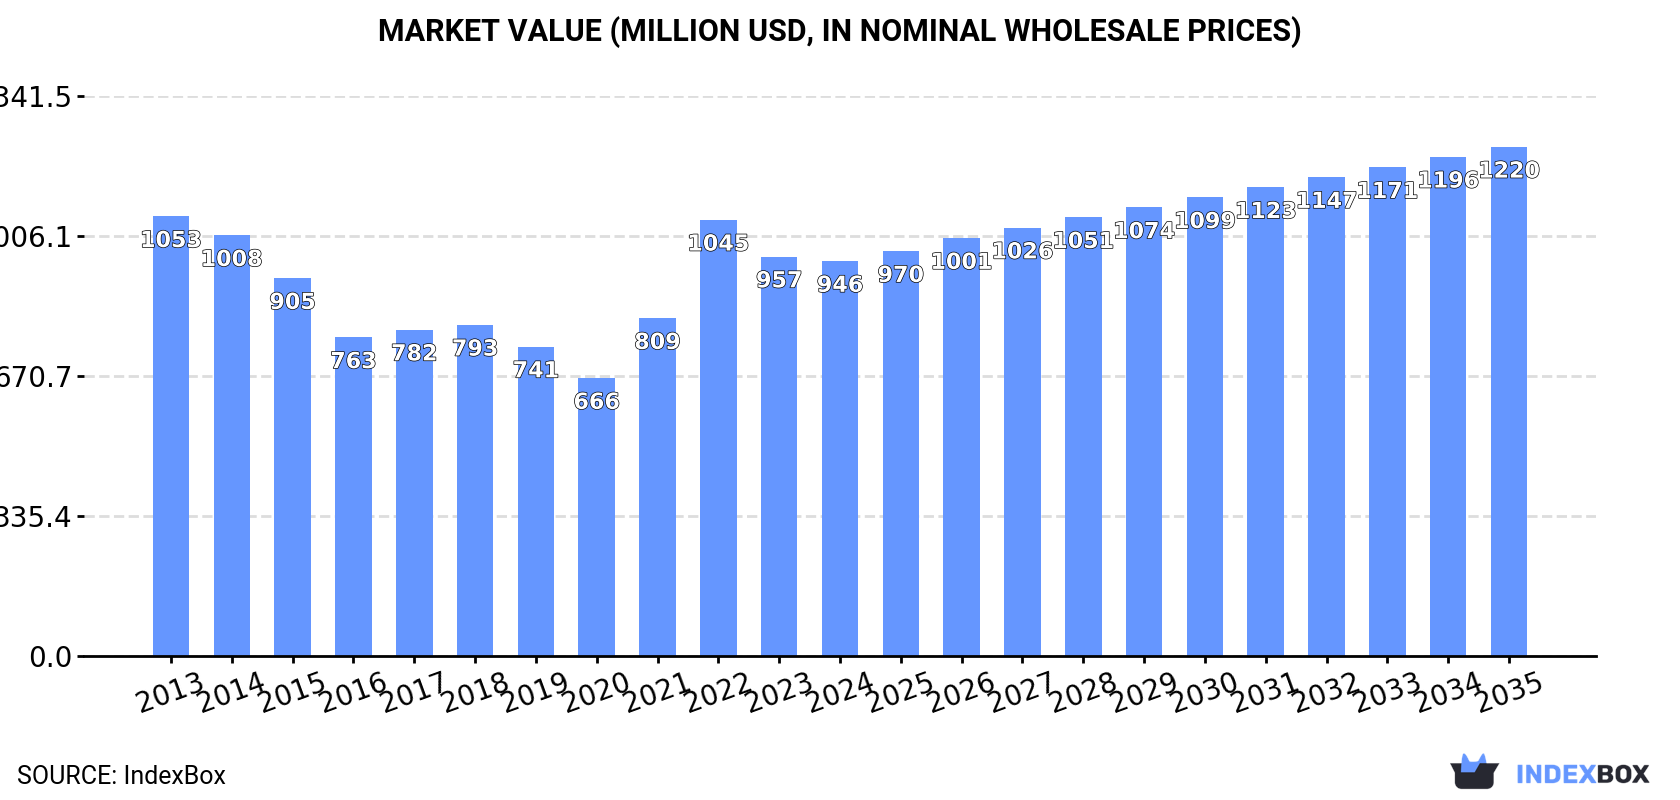
In value terms, the market is forecast to increase with an anticipated CAGR of +2.3% for the period from 2024 to 2035, which is projected to bring the market value to $1.2B (in nominal wholesale prices) by the end of 2035.
 ConsumptionLatin America and the Caribbean’s Consumption of Toluene
In 2024, consumption of toluene increased by 0.7% to 1.1M tons, rising for the fifth year in a row after four years of decline. Over the period under review, consumption continues to indicate a relatively flat trend pattern. As a result, consumption reached the peak volume of 1.1M tons; afterwards, it flattened through to 2024.
The revenue of the toluene market in Latin America and the Caribbean fell to $946M in 2024, approximately reflecting the previous year. This figure reflects the total revenues of producers and importers (excluding logistics costs, retail marketing costs, and retailers’ margins, which will be included in the final consumer price). Overall, consumption, however, saw a mild decrease. Over the period under review, the market hit record highs at $1.1B in 2013; however, from 2014 to 2024, consumption remained at a lower figure.
Consumption By Country
Brazil (548K tons) remains the largest toluene consuming country in Latin America and the Caribbean, comprising approx. 50% of total volume. Moreover, toluene consumption in Brazil exceeded the figures recorded by the second-largest consumer, Argentina (161K tons), threefold. Colombia (139K tons) ranked third in terms of total consumption with a 13% share.
From 2013 to 2024, the average annual growth rate of volume in Brazil was relatively modest. The remaining consuming countries recorded the following average annual rates of consumption growth: Argentina (+0.7% per year) and Colombia (+1.3% per year).
In value terms, Brazil ($452M) led the market, alone. The second position in the ranking was taken by Argentina ($157M). It was followed by Colombia.
From 2013 to 2024, the average annual growth rate of value in Brazil totaled -1.6%. The remaining consuming countries recorded the following average annual rates of market growth: Argentina (-1.1% per year) and Colombia (+0.8% per year).
The countries with the highest levels of toluene per capita consumption in 2024 were Argentina (3.4 kg per person), Venezuela (3.1 kg per person) and Colombia (2.7 kg per person).
From 2013 to 2024, the most notable rate of growth in terms of consumption, amongst the key consuming countries, was attained by Mexico (with a CAGR of +15.9%), while consumption for the other leaders experienced more modest paces of growth.
ProductionLatin America and the Caribbean’s Production of Toluene
In 2024, approx. 1M tons of toluene were produced in Latin America and the Caribbean; remaining relatively unchanged against 2023 figures. Overall, production saw a relatively flat trend pattern. The most prominent rate of growth was recorded in 2023 when the production volume increased by 5.2% against the previous year. Over the period under review, production hit record highs at 1.2M tons in 2015; however, from 2016 to 2024, production remained at a lower figure.
In value terms, toluene production fell modestly to $880M in 2024 estimated in export price. Over the period under review, production saw a pronounced downturn. The pace of growth appeared the most rapid in 2022 when the production volume increased by 30%. Over the period under review, production reached the peak level at $1.2B in 2013; however, from 2014 to 2024, production failed to regain momentum.
Production By Country
The country with the largest volume of toluene production was Brazil (569K tons), comprising approx. 55% of total volume. Moreover, toluene production in Brazil exceeded the figures recorded by the second-largest producer, Argentina (185K tons), threefold. Colombia (151K tons) ranked third in terms of total production with a 15% share.
In Brazil, toluene production shrank by an average annual rate of -1.8% over the period from 2013-2024. The remaining producing countries recorded the following average annual rates of production growth: Argentina (+1.6% per year) and Colombia (+1.3% per year).
ImportsLatin America and the Caribbean’s Imports of Toluene
Toluene imports rose significantly to 113K tons in 2024, growing by 9.4% against the previous year. Total imports indicated a moderate expansion from 2013 to 2024: its volume increased at an average annual rate of +3.8% over the last eleven-year period. The trend pattern, however, indicated some noticeable fluctuations being recorded throughout the analyzed period. Based on 2024 figures, imports decreased by -9.6% against 2022 indices. The most prominent rate of growth was recorded in 2020 with an increase of 38%. The volume of import peaked at 125K tons in 2022; however, from 2023 to 2024, imports stood at a somewhat lower figure.
In value terms, toluene imports totaled $129M in 2024. Overall, imports showed pronounced growth. The most prominent rate of growth was recorded in 2022 with an increase of 81%. As a result, imports reached the peak of $152M. From 2023 to 2024, the growth of imports remained at a lower figure.
Imports By Country
Mexico prevails in imports structure, resulting at 74K tons, which was near 66% of total imports in 2024. It was distantly followed by Guatemala (9.6K tons), Peru (5.9K tons) and the Dominican Republic (5.7K tons), together comprising a 19% share of total imports. Honduras (3.5K tons), Costa Rica (2.4K tons) and Ecuador (2.4K tons) followed a long way behind the leaders.
Mexico was also the fastest-growing in terms of the toluene imports, with a CAGR of +13.8% from 2013 to 2024. At the same time, Honduras (+3.0%) and Guatemala (+1.8%) displayed positive paces of growth. By contrast, Costa Rica (-1.4%), the Dominican Republic (-2.2%), Peru (-5.3%) and Ecuador (-5.7%) illustrated a downward trend over the same period. Mexico (+42 p.p.) significantly strengthened its position in terms of the total imports, while Costa Rica, Guatemala, Ecuador, the Dominican Republic and Peru saw its share reduced by -1.6%, -2.1%, -4%, -4.7% and -9.1% from 2013 to 2024, respectively. The shares of the other countries remained relatively stable throughout the analyzed period.
In value terms, Mexico ($73M) constitutes the largest market for imported toluene in Latin America and the Caribbean, comprising 56% of total imports. The second position in the ranking was held by the Dominican Republic ($13M), with a 10% share of total imports. It was followed by Guatemala, with a 9.4% share.
In Mexico, toluene imports increased at an average annual rate of +10.8% over the period from 2013-2024. The remaining importing countries recorded the following average annual rates of imports growth: the Dominican Republic (+2.6% per year) and Guatemala (+1.0% per year).
Import Prices By Country
In 2024, the import price in Latin America and the Caribbean amounted to $1,144 per ton, waning by -2.1% against the previous year. Overall, the import price continues to indicate a slight curtailment. The pace of growth was the most pronounced in 2022 an increase of 36%. Over the period under review, import prices attained the maximum at $1,387 per ton in 2013; however, from 2014 to 2024, import prices stood at a somewhat lower figure.
Prices varied noticeably by country of destination: amid the top importers, the country with the highest price was the Dominican Republic ($2,256 per ton), while Honduras ($929 per ton) was amongst the lowest.
From 2013 to 2024, the most notable rate of growth in terms of prices was attained by the Dominican Republic (+5.0%), while the other leaders experienced more modest paces of growth.
ExportsLatin America and the Caribbean’s Exports of Toluene
In 2024, approx. 60K tons of toluene were exported in Latin America and the Caribbean; leveling off at the year before. Overall, exports saw a deep contraction. The most prominent rate of growth was recorded in 2023 with an increase of 89% against the previous year. Over the period under review, the exports hit record highs at 190K tons in 2014; however, from 2015 to 2024, the exports stood at a somewhat lower figure.
In value terms, toluene exports amounted to $57M in 2024. Over the period under review, exports continue to indicate a deep slump. The most prominent rate of growth was recorded in 2019 with an increase of 54% against the previous year. Over the period under review, the exports reached the peak figure at $228M in 2013; however, from 2014 to 2024, the exports failed to regain momentum.
Exports By Country
Argentina (23K tons) and Brazil (21K tons) were the major exporters of toluene in 2024, finishing at near 38% and 35% of total exports, respectively. It was distantly followed by Colombia (13K tons), committing a 21% share of total exports. Guatemala (1.8K tons) and Mexico (0.9K tons) held a minor share of total exports.
From 2013 to 2024, the biggest increases were recorded for Argentina (with a CAGR of +10.6%), while shipments for the other leaders experienced more modest paces of growth.
In value terms, Argentina ($20M), Brazil ($18M) and Colombia ($15M) appeared to be the countries with the highest levels of exports in 2024, with a combined 93% share of total exports.
Argentina, with a CAGR of +5.1%, saw the highest growth rate of the value of exports, in terms of the main exporting countries over the period under review, while shipments for the other leaders experienced more modest paces of growth.
Export Prices By Country
In 2024, the export price in Latin America and the Caribbean amounted to $944 per ton, picking up by 1.9% against the previous year. Over the period under review, the export price, however, showed a pronounced curtailment. The growth pace was the most rapid in 2021 an increase of 67% against the previous year. The level of export peaked at $1,245 per ton in 2013; however, from 2014 to 2024, the export prices stood at a somewhat lower figure.
Prices varied noticeably by country of origin: amid the top suppliers, the country with the highest price was Guatemala ($1,318 per ton), while Mexico ($653 per ton) was amongst the lowest.
From 2013 to 2024, the most notable rate of growth in terms of prices was attained by Guatemala (-0.5%), while the other leaders experienced a decline in the export price figures.
Source: IndexBox Market Intelligence Platform
This report provides a comprehensive view of the toluene industry in Latin America and the Caribbean, tracking demand, supply, and trade flows across the regional value chain. It explains how demand across key channels and end-use segments shapes consumption patterns, while also mapping the role of input availability, production efficiency, and regulatory standards on supply.
Beyond headline metrics, the study benchmarks prices, margins, and trade routes so you can see where value is created and how it moves between exporters and importers within Latin America and the Caribbean. The analysis is designed to support strategic planning, market entry, portfolio prioritization, and risk management in the toluene landscape in Latin America and the Caribbean.
Quick navigation
Key findings
Regional demand is shaped by both household and industrial usage, with trade flows linking supply hubs to import-reliant countries.
Pricing dynamics reflect unit values, freight costs, exchange rates, and regulatory shifts that affect sourcing decisions.
Supply depends on input availability and production efficiency, creating distinct cost curves across Latin America and the Caribbean.
Market concentration varies by country, creating different competitive landscapes and entry barriers.
The 2035 outlook highlights where capacity investment and demand growth are most aligned within the region.
Report scope
The report combines market sizing with trade intelligence and price analytics for Latin America and the Caribbean. It covers both historical performance and the forward outlook to 2035, allowing you to compare cycles, structural shifts, and policy impacts across countries and sub-regions.
Market size and growth in value and volume terms
Consumption structure by end-use segments and countries
Production capacity, output, and cost dynamics
Regional trade flows, exporters, importers, and balances
Price benchmarks, unit values, and margin signals
Competitive context and market entry conditions
Product coverageProdcom 20141225 – TolueneCountry coverageCountry profiles and benchmarks
For the regional report, country profiles provide a consistent view of market size, trade balance, prices, and per-capita indicators across Latin America and the Caribbean. The profiles highlight the largest consuming and producing markets and allow direct benchmarking across peers.
Methodology
The analysis is built on a multi-source framework that combines official statistics, trade records, company disclosures, and expert validation. Data are standardized, reconciled, and cross-checked to ensure consistency across time series.
International trade data (exports, imports, and mirror statistics)
National production and consumption statistics
Company-level information from financial filings and public releases
Price series and unit value benchmarks
Analyst review, outlier checks, and time-series validation
All data are normalized to a common product definition and mapped to a consistent set of codes. This ensures that comparisons across time are aligned and actionable.
Forecasts to 2035
The forecast horizon extends to 2035 and is based on a structured model that links toluene demand and supply to macroeconomic indicators, trade patterns, and sector-specific drivers. The model captures both cyclical and structural factors and reflects known policy and technology shifts within Latin America and the Caribbean.
Historical baseline: 2012-2025
Forecast horizon: 2026-2035
Scenario-based sensitivity to income growth, substitution, and regulation
Capacity and investment outlook for major producing countries
Each country projection is built from its own historical pattern and the regional context, allowing the report to show where growth is concentrated and where risks are elevated.
Price analysis and trade dynamics
Prices are analyzed in detail, including export and import unit values, regional spreads, and changes in trade costs. The report highlights how seasonality, freight rates, exchange rates, and supply disruptions influence pricing and margins.
Price benchmarks by country and sub-region
Export and import unit value trends
Seasonality and calendar effects in trade flows
Price outlook to 2035 under baseline assumptions
Profiles of market participants
Key producers, exporters, and distributors are profiled with a focus on their operational scale, geographic footprint, product mix, and market positioning. This helps identify competitive pressure points, partnership opportunities, and routes to differentiation.
Business focus and production capabilities
Geographic reach and distribution networks
Cost structure and pricing strategy indicators
Compliance, certification, and sustainability context
How to use this report
Quantify regional demand and identify the most attractive country markets
Evaluate export opportunities and prioritize target destinations
Track price dynamics and protect margins
Benchmark performance against regional competitors
Build evidence-based forecasts for investment decisions
This report is designed for manufacturers, distributors, importers, wholesalers, investors, and advisors who need a clear, data-driven picture of toluene dynamics in Latin America and the Caribbean.
FAQ
What is included in the toluene market in Latin America and the Caribbean?
The market size aggregates consumption and trade data at country and sub-regional levels, presented in both value and volume terms.
How are the forecasts to 2035 built?
The projections combine historical trends with macroeconomic indicators, trade dynamics, and sector-specific drivers.
Does the report cover prices and margins?
Yes, it includes export and import unit values, regional spreads, and a pricing outlook to 2035.
Which countries are profiled in detail?
The report provides profiles for the largest consuming and producing countries in Latin America and the Caribbean.
Can this report support market entry decisions?
Yes, it highlights demand hotspots, trade routes, pricing trends, and competitive context.