
For investors watching NYSE:CB, these results come with a share price of $329.45 and a value score of 4. The stock has returned 8.5% over the past week, 6.3% year to date, and 22.4% over the past year, with gains of 59.8% over 3 years and 116.6% over 5 years. Taken together with the reported record earnings, this update may be a notable data point for those who follow large insurers.
Record profitability, a record low combined ratio, and growth in both property and casualty and life premiums indicate a business that is currently operating efficiently across key lines. As you consider NYSE:CB, these operating trends and the current share price can help frame questions about the sustainability of margins, capital deployment, and how the company might respond to future market conditions.
Stay updated on the most important news stories for Chubb by adding it to your watchlist or portfolio. Alternatively, explore our Community to discover new perspectives on Chubb.
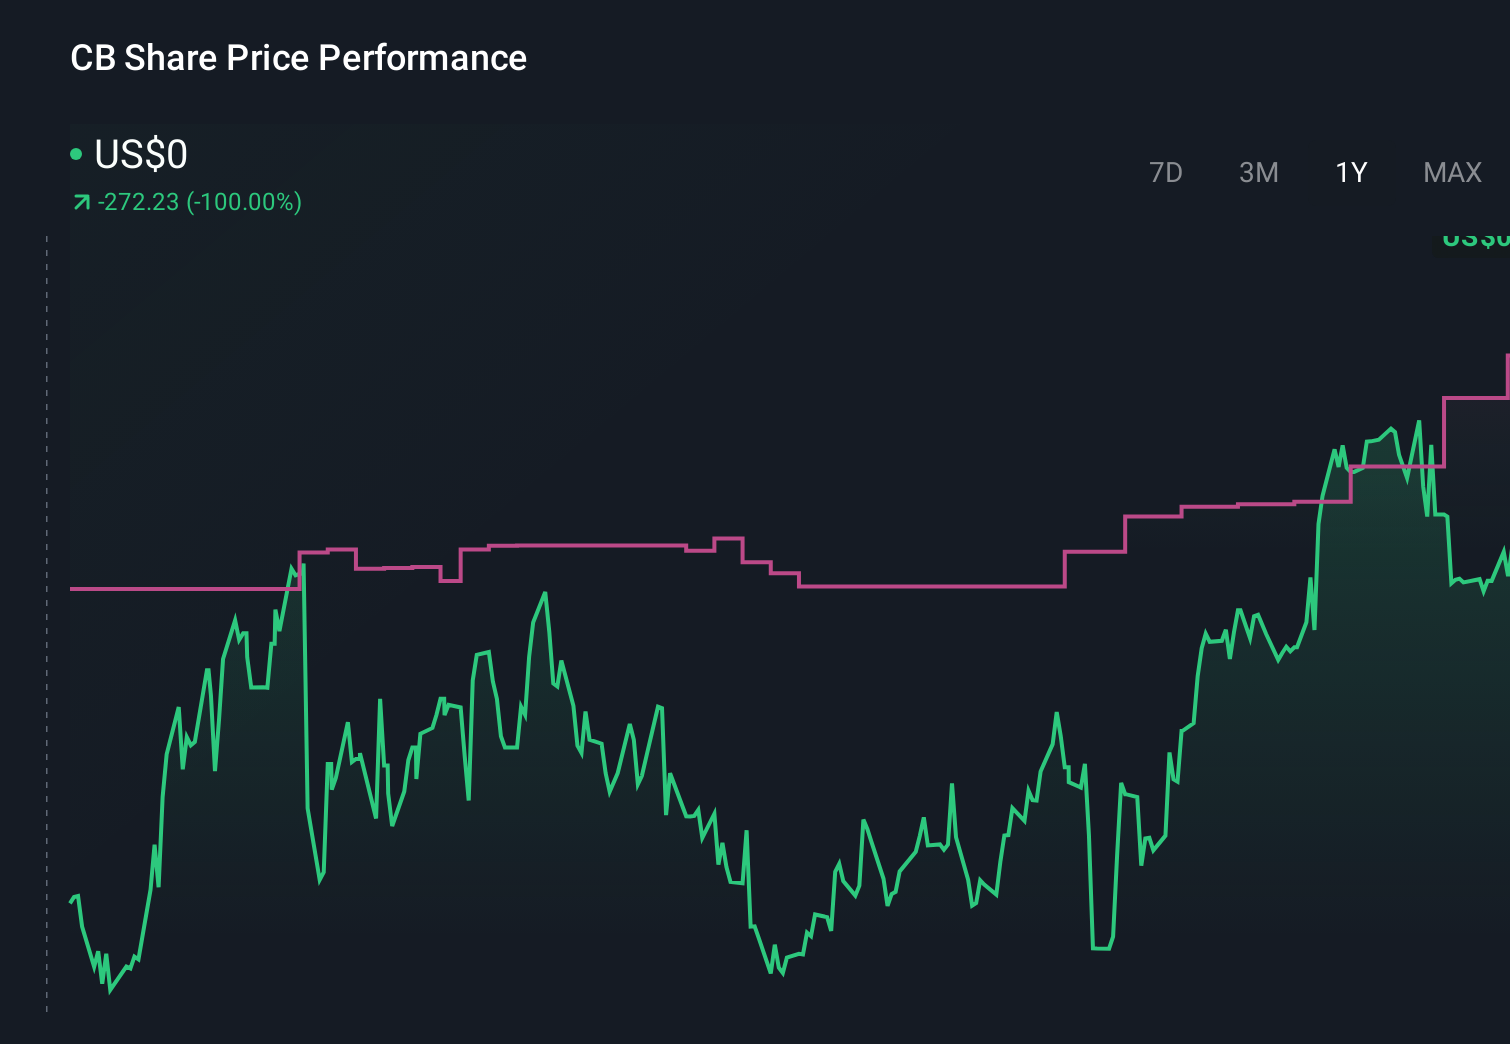 NYSE:CB 1-Year Stock Price Chart
Why Chubb could be great value
Quick Assessment ⚖️ Price vs Analyst Target: At US$329.45, Chubb trades about 1% above the US$326.13 analyst target, which sits well inside the US$283 to US$372 range. ✅ Simply Wall St Valuation: Simply Wall St’s model currently views the shares as trading about 50.9% below its estimated fair value. ✅ Recent Momentum: The stock has returned about 4.5% over the past 30 days.
Check out Simply Wall St’s
in depth valuation analysis for Chubb.
Key Considerations 📊 Record operating results, strong underwriting and life premium growth, and a record low combined ratio all feed into the current profitability story you are assessing at US$329.45 per share. 📊 Keep an eye on the combined ratio, life and P&C premium trends, and how earnings compare with the current P/E of 12.5 versus the Insurance industry average of about 13.3. ⚠️ The flagged risk is significant insider selling over the past 3 months, which some investors weigh against the company level rewards being highlighted. Dig Deeper
For the full picture including more risks and rewards, check out the
complete Chubb analysis.
This article by Simply Wall St is general in nature. We provide commentary based on historical data
and analyst forecasts only using an unbiased methodology and our articles are not intended to be financial advice. It does not constitute a recommendation to buy or sell any stock, and does not take account of your objectives, or your
financial situation. We aim to bring you long-term focused analysis driven by fundamental data.
Note that our analysis may not factor in the latest price-sensitive company announcements or qualitative material.
Simply Wall St has no position in any stocks mentioned.
Our new AI Stock Screener scans the market every day to uncover opportunities.
• Dividend Powerhouses (3%+ Yield)
• Undervalued Small Caps with Insider Buying
• High growth Tech and AI Companies
Or build your own from over 50 metrics.
Have feedback on this article? Concerned about the content? Get in touch with us directly. Alternatively, email editorial-team@simplywallst.com